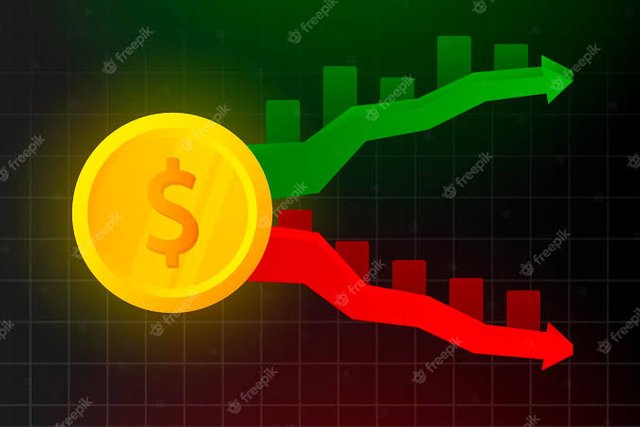
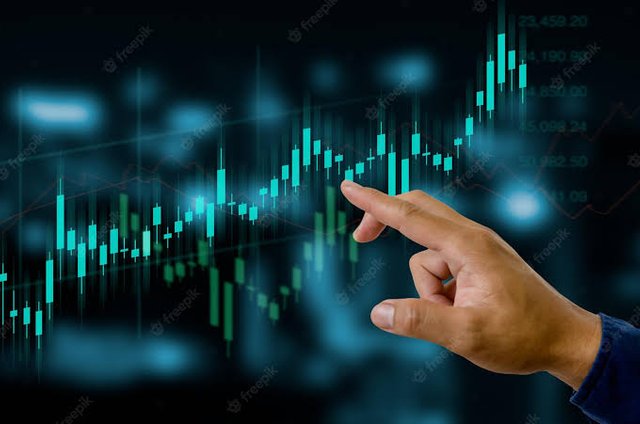
The red candle indicates that the closing price was lower than the opening price. That is, the value of the asset decreased during the specified trading period.On the other side,A green candle indicates that the closing price was higher than the opening price because the asset price went up.The red and green candles in the above image show bullish and bearish candles respectively, as the price opens in one direction and closes in the opposite direction.The wide body is the part of the candle, and it is also the main part that shows the opening and closing price.In a bullish candle, the opening price is lower than the closing price, which indicates a price increase over the period.In a bearish candle, the opening price must be higher than the closing price, which indicates that the price has fallen during that particular time period.The wide-bodied candle represents market pressure in the cryptocurrency. An extended length of the same scale indicates a strong move, while a short length represents modest price movement within the token community.Green usually represents a bullish candle, while red is a bearish candle. However, you can change the color at any time according to your choice and business model. The wick is the thicker part of the candle attached to the upper and lower body of the candle.The wick above the actual body of the candlestick indicates the high price level for the timeframe, while the candle below indicates the low price for that particular timeframe.
The Information For Us From Candlestick Chart In CryptoCurrency Trading!
Candlesticks not only show price action over time but also help experienced traders analyze patterns to gauge market sentiment. It also helps traders make predictions about where the market might go next.For example, a long candlestick below the candlestick could mean that traders are buying an asset. It can be a good indicator because it has the ability to predict the rise in asset prices.
A long candlestick at the top of the candlestick could indicate that traders are looking to take profits, which indicates a major potential sell-off in the near future.
If the body occupies almost all of the candle, with no or smaller candles visible on either side, this could indicate a strong uptrend on the green candle or a strong downtrend on the red candle.
Understanding the candlesticks of a particular asset is an element of a trading strategy known as technical analysis which is a process by which investors look at past price movements to identify potential future trends and opportunities.Try studying movement.
Crypto Candlesticks charts are a powerful component of the cryptocurrency market.The coins of crypto currency for traders relay in different types of charts like candlestick.You can consider the Cryptocurrency Candlestick Chart Trading System as standalone cryptocurrency trading strategy, or you can use these tools to add trading ability to your strategy.
Thanks To
@hungry-griffin
@blacks
@rme
Regards By
@zeemooo

