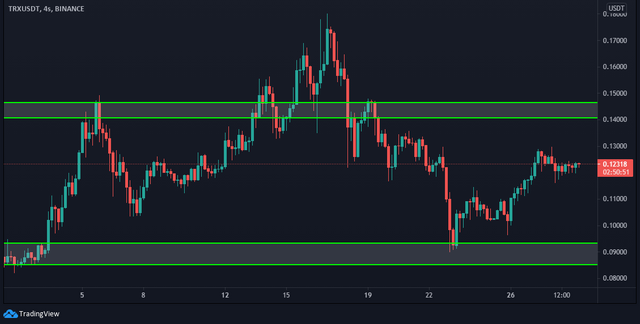
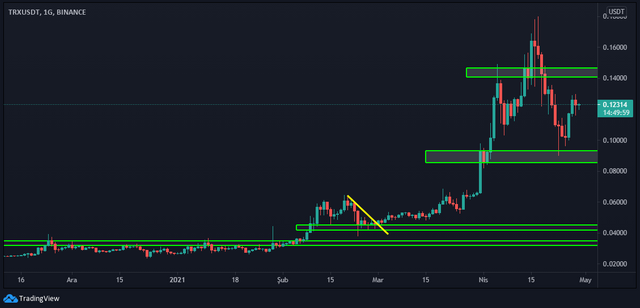
Hello there. I wanted to share my TRX / USDT chart with you. I usually use the daily chart. However, I follow the 240 minute chart while trading.
4 Hour chart.

Daily chart.

As can be seen in the graph, there is a supply-demand zone at the level of 0.085-0.093 and at the level of 0.141-0.146. I will be more careful when these levels are seen.
Note: I do not provide investment advice. You should get your investment profits according to your own financial situation. See you in new posts.