LESSON: Key Resistance or Support Being Broken
Key levels in the market are what the market works off and respects. Depending on whether these levels hold or break can on occasions determine what side of the market we want to be on.
Whilst this is not so much picking the trend or change of a trend is it just as important because this could be the difference between being on the right side of the market and trading against the flow.
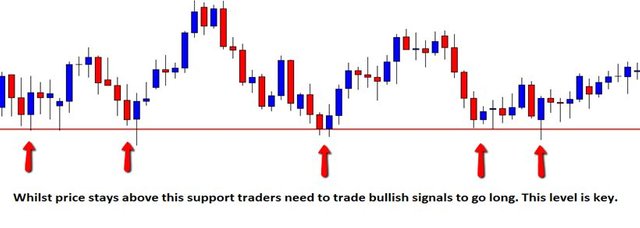
The chart below shows a key level that price has bounced from on many occasions. Clearly this level is a very obvious level and something this pair is basing its price around. Whilst price keeps bouncing from this level the best play is to trade long.
The logical play would be to go long from this support. Trading short into this level would be a very dangerous play.

professional_price_action-024
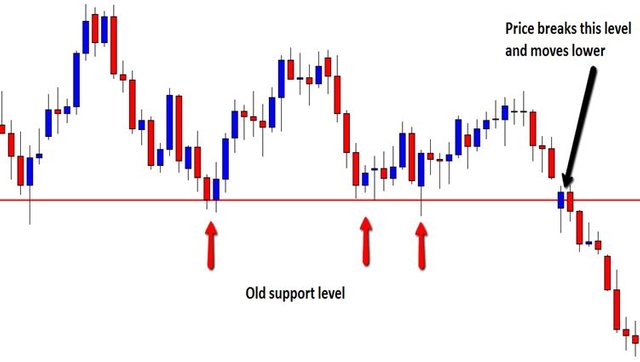
The following chart shows the same pair as above. In this second chart price has broken this key level and moved lower. Now this level has been broken the whole dynamic changes for this pair. No longer should traders look to go long from this support level.
Now this old support has broken traders could look for this level to hold as new resistance should price retest it. This level has gone from being a good level to go long, to a new level to look for bearish Price Action to get short.

professional_price_action-025
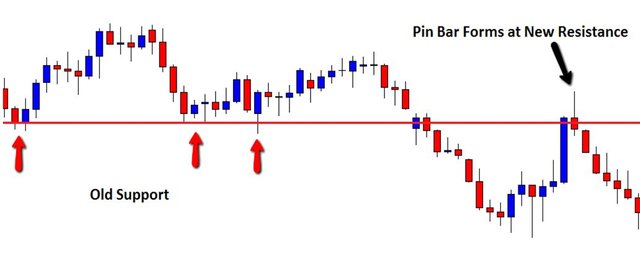
The last chart shows price retesting this level. This level does hold as new resistance and forms a bearish Pin Bar for traders to get short.
This is a very good example of how traders can read the Price Action story and trade a very high probability setup.
This chart clearly showed that the bias on this pair went from being long to when the support was holding, to short once the support level was broken.

professional_price_action-026
Module Three
Duration: 5 mins
Module Progress:
70% Complete
Next Lesson »
« Previous Lesson