Hello Friend
How are you doing today. I am sure you are very much fine today and doing great with your loved ones. Today, I want us to learn something new and it's called "Technical Analysis".
I know most beginners in the crypto industry might not understand this. In order for you to perform better both in crypto trading and forex trading you must have a deep understanding of technical analysis. Let's get started fast.
What is technical analysis?
My dear friend Technical Analysis is method, or tool that trader used to predict the future outcome of a cryptocurrency or any digital asset. In a nutshell, technical analysis is a tools that is used to predict the price and movements of a tradable asset.
Traders make use of technical analysis to know both the past price and future movement in price of any currency pair. A lot of traders believe that paste price action or current price action in the market is the best way in which they can be able to predict future price by using an indicator.
With technical analysis, you can be able to know when you are to buy or sell cryptocurrency in the market.(one when you are to enter the market). It is with the help of technical analysis you can be able to place a good trade entries such as Entry price, Stoploss and Take profit. All this is what traders used to minimize they risk when entry into a market, but without proper knowledge of technical analysis your chance of risk is very high.
Technical Analysis Timeframe
Traders make used of the different timeframe to study price movement. Timeframe and technical indicators are the the two variables for technical analysis. In technical analysis chart, there are different timeframe that you can use and predict price movement. Some of theses timeframe on chart are mentioned below;
- 5Minute timeframe
- 15Minute timeframe
- Daily timeframe
- 1hour timeframe
- 4hour timeframe
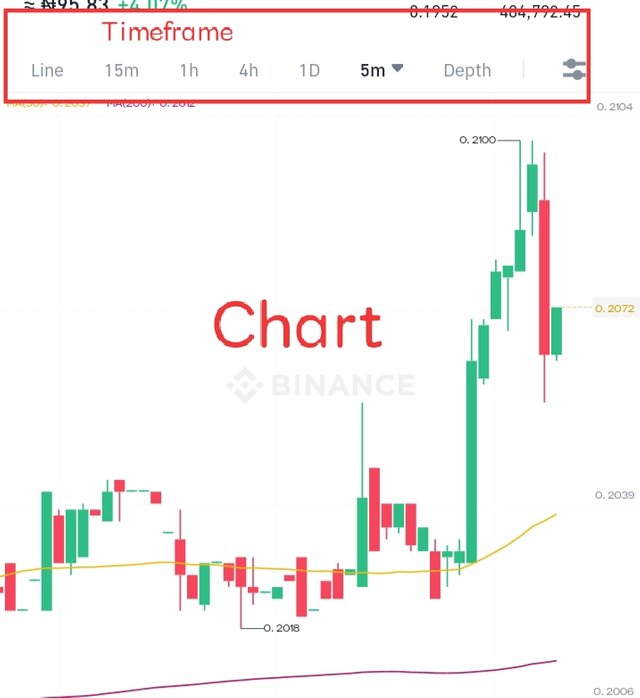 screenshot gotten from Binance exchange
As a trader the type of timeframe that you select in your chart is determined by your trading style. If you are an intra-day trader, it would be best for you to make use of 5 minute and 15minute timeframe chart. But if you are the type of trader that wish to hold his/her position overnight (i.e for longer period of time) it will be best that you go for 4hour timeframe and above. Also note that on every charts there is a candlesticks.
Candlesticks Chart
Candlesticks chart is what show the movement of price of an asset on a chart. It is formed base on the price action at the time of any slice movement. The candlestick on a 15minute chart will only show you the price action for 15minute, whereas that of 4hour chart will only show the price action in every 4hour.
It is through the candlestick, that you can get to see highest point and lowest point indicating how the price has move up or down. Also in a candlestick, there is a body and it's usually colour in two form which is the Green and Red colours.
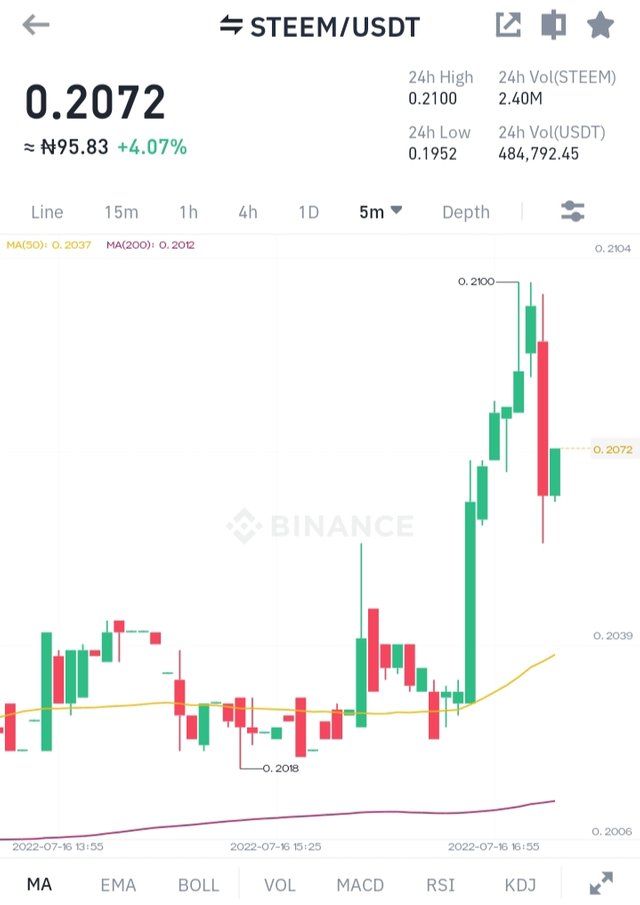 screenshot gotten from Binance exchange
The green candlestick indicate a bullish trend, whereas the red candlestick is what indicate a bearish trend. In a candlestick there is also a thicker parts,that inform traders about and opening price and closing prices of a certain time interval.
In the candlestick if it's the green candlestick body is formed is simply means that the closing price of the upper candlestick body was higher than that of the opening price which is the bottom candlestick body. In a case where it is the Red candlestick body that is formed, it means that the price of the traded asset was higher than that of the closing price of the asset.
As a trader,there are some candlestick that I would like you to know and these are the candlesticks that can help you in your trading.
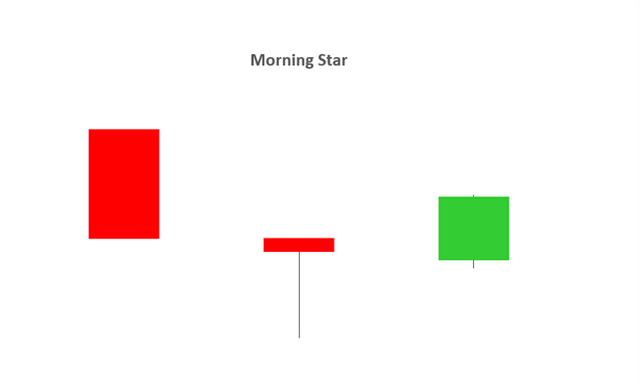
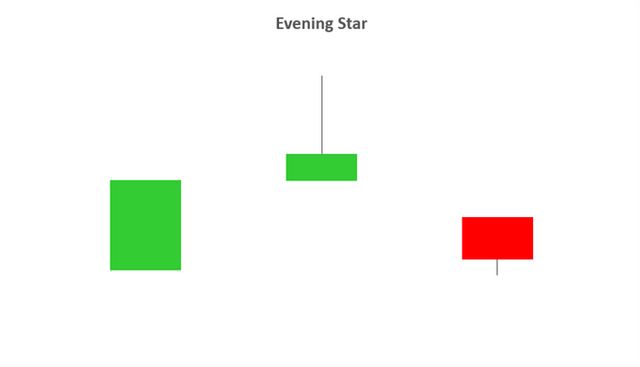
Morning and Evening Star Candlestick
This is the candlestick that occur at the end of downward or upward trends in a relative manner and tend to indicate reversal patterns. The image below is how morning and evening star candlestick looks like.
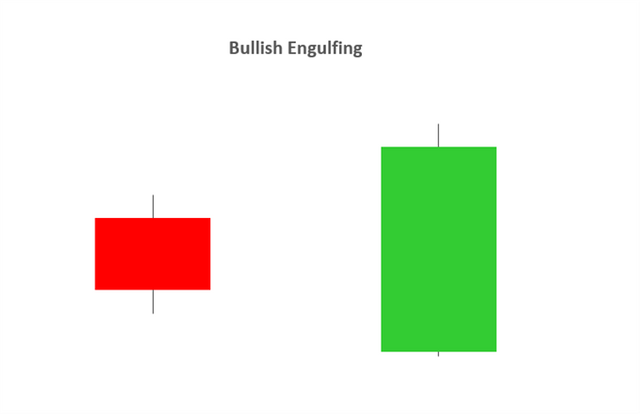
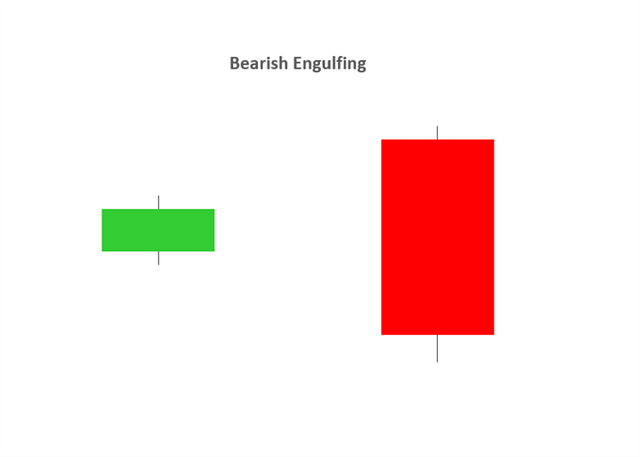
Bullish & Bearish Engulfing
As I have earlier said, the Bullish engulfing is and indication that the market is experiencing a bullish trend and buying pressure is more than selling. Bearish engulfing candlestick is an indication that the market is experiencing a bearish trend and selling pressure is more than Buying.
The bullish engulfing candlestick is the green one, while the red is the bearish engulfing candlestick.
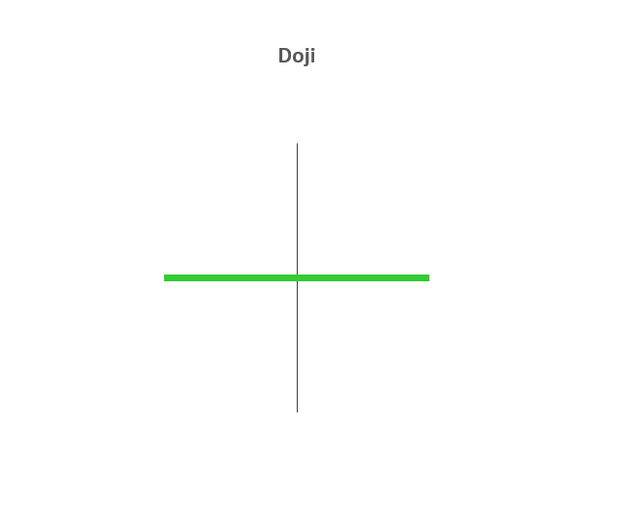
DOJI Candlestick
This is the candlestick that indicate current trend of a potential reversal consolidation. Doji pattern happen at the top of an uptrend, middle of a trend or at the bottom of a downtrend.
Hammer Candlestick
This is the type of candlestick that is also see as a bullish reversal that usually happens at the bottom of a downtrend trend movement.
Conclusion;
In this tutorial, we have learned about technical analysis, timeframe charts, candlestick and the best candlesticks that can help us in trading. Thank you for reading....


Note: You must enter the tag #fintech among the first 4 tags for your post to be reviewed.
Downvoting a post can decrease pending rewards and make it less visible. Common reasons:
Submit
Congratulations !!!
You got upvote from the Steem-Database community.
Please read the guide:
DELEGATION
We are very open to receiving delegations from anyone who wants to support the community. if you are interested in becoming a delegator for Steem-Database you can give any delegation you like :
Downvoting a post can decrease pending rewards and make it less visible. Common reasons:
Submit
🎉🎉🎉Congratulations !!!🎉🎉🎉
Your post being nominated for BOOMING support. Improve the quality of your posts and keep the original work.
Please read the following guide:
Guidlines Booming Support | Steem-Database
Downvoting a post can decrease pending rewards and make it less visible. Common reasons:
Submit