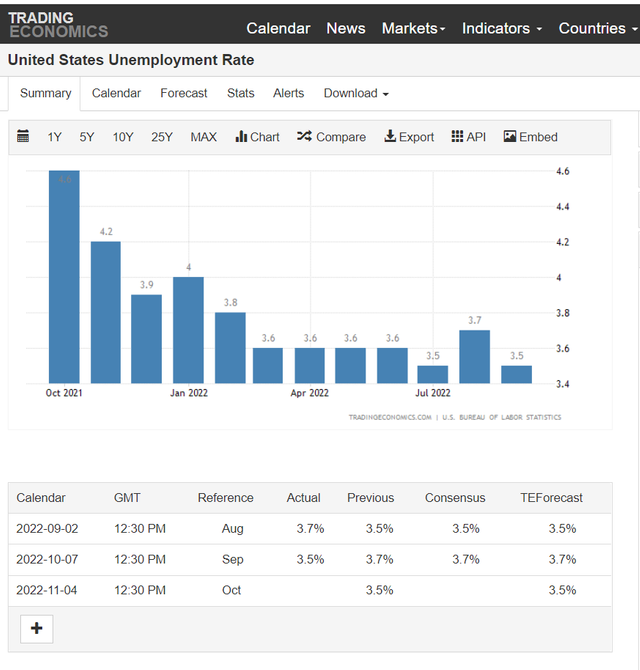
The unemployment rate is down as expected in scenario 1, it's not a bad thing that we have fewer unemployed people, but with inflation that has exploded it won't help much to bring it down.
Now remains the most important news on the inflation rate next Thursday 13/10 at 2:30 p.m. and if inflation doesn't come down as expected we will surely have big red candle!
Scenario 1 : https://www.publish0x.com/the-king-of-crypto/btc-daily-technical-analysis-possible-long-squeeze-speculati-xmyjxxw

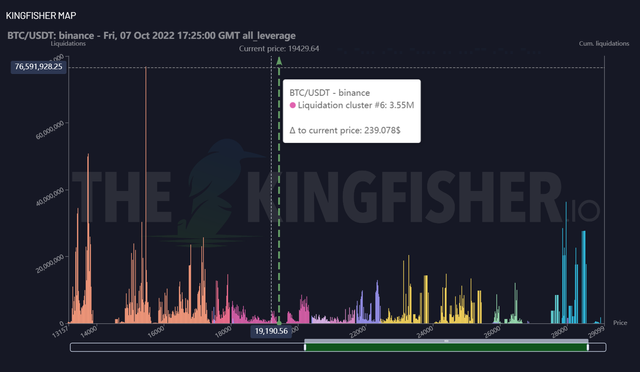
Not far from 19.2K with the last small peak to the south close to the price, before consolidating, and then to see afterwards if the Longs or the Shorts which will open more positions?
What I've noticed in the last few days on liquidations close to price via the King Fisher map is that we have fewer traders with high leverage, since the big spikes are a bit far from price, which I can conclude that we will soon have the big candle of 10% to 20% either in the south or in the north, and in my opinion it will be next Thursday and everything will depend on the rate of inflation.
The market is doing a good job of cleaning up, and especially capitulating traders with high leverage.

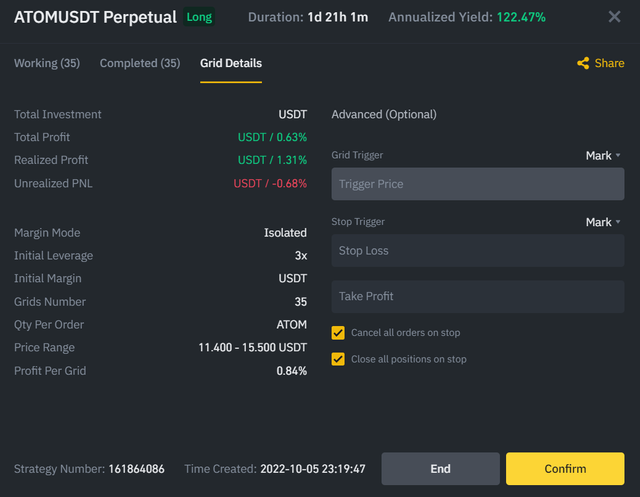
I'm still on the Long Trade ATOM/USDT in Grid trading, I see today's drop as a reaction to the unemployment rate not as expected, but I think it doesn't impact the market much more than the inflation.
Interest rates are dependent on inflation and the market always prices interest rates after the announcement of inflation.
I just see a trading range with stops hunting in both directions, but with low unemployment rates the market can price ahead inflation rates which may be higher than expected to estimate an aggressive interest rates between 0.75% to 1%
I don't know what you think? whether you agree or not? I will be happy to have you feedback 🙂
- More details about Long ATOM/USDT with Grid Trading: https://www.publish0x.com/the-king-of-crypto/btc-daily-technical-analysis-grid-trading-strategy-for-the-l-xmyjrdk

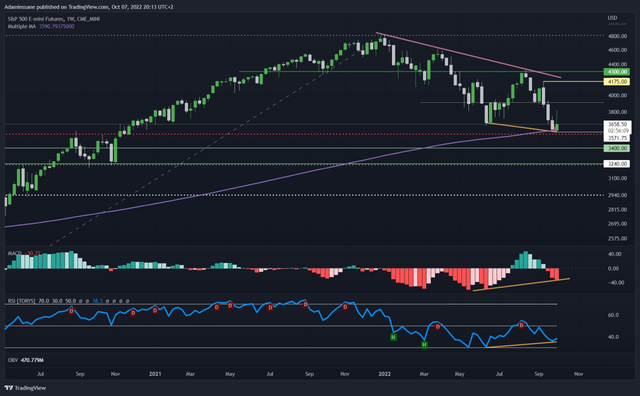
S&P 500: 1W
High Confluence with multiple indicators pointing to the same thing: Bullish
- Support level at 3587 on the last top at the end of August 2020.
- MA 200 as support.
- 38.2% fib.
- Bullish divergence on the RSI and the MACD, with a price making lower lows and the RSI with the MACD lower highs.
https://www.tradingview.com/x/RF2RptpY/

👉 Follow the links below to the best & Secured Exchanges that I use for trading & often gives rewards for using their platform like Learn & Earn Program, making deposit & Trading on spot or Futures, Trading Competition, ...etc.
📈 Bybit: Get up to 4030 USDT in rewards just by signing up!
https://www.bybit.com/app/register?ref=7Wgmj
📈 Binance: 10% discount on Binance Futures trading fees!
https://www.binance.com/en/futures/ref/38451215
📈 FTX: Sign Up Bonus of 5% fee discount on all your trades.
https://ftx.com/referrals#a=1768923
📈 Phemex: Up to $180 in welcome bonuses waiting for you.
https://phemex.com/register?group=718&referralCode=BAR9K
📈 Kucoin: Rewards for users Up to 10 million USDT
https://www.kucoin.com/ucenter/signup?rcode=Kvyf2d
📈 Bitmex: Up to 80 BMEX Tokens Welcome Offer.
https://www.bitmex.com/app/register/xXePh3
🔑 Be the first to have my analyzes before posting them on Publish0x 👀 Follow the Links bellow to my Telegram channels:
☑️ English: https://t.me/tradingwithbinance
☑️ French: https://t.me/Adaminssane1
Nice post keep it up buddy.
Hope you got the 100 STEEM & 1000 TAKI Airdrop, if not get it quickly before the campaign ends.
go to this official taki announcement how to get the airdrop CLICK HERE
Downvoting a post can decrease pending rewards and make it less visible. Common reasons:
Submit