Volume Delta Indicator
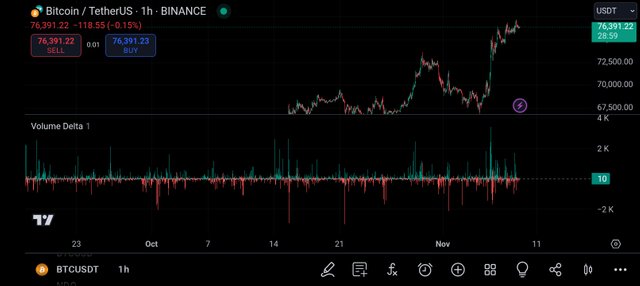
Many volume Indicators are being used by traders to analyze the crypto market and the volume delta is one of them. It is an indicator that we can use to know the difference between buying volume and selling volume within a specific timeframe like 30-minute, 1-hour, 2-hour timeframe, etc.

The delta is the difference between the buy order and sell order, which is what the volume delta indicator calculates for us offering us insight into the intensity of buying pressure vs selling pressure in the crypto market and others. Volume Delta is mostly used in trading platforms that provide volume-based analysis or order flow, which we can mostly find in forex trading, futures trading, etc.
Interpretation

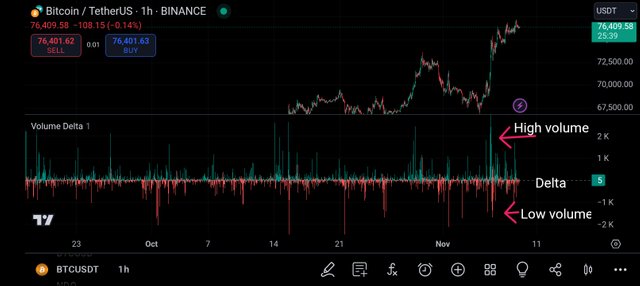
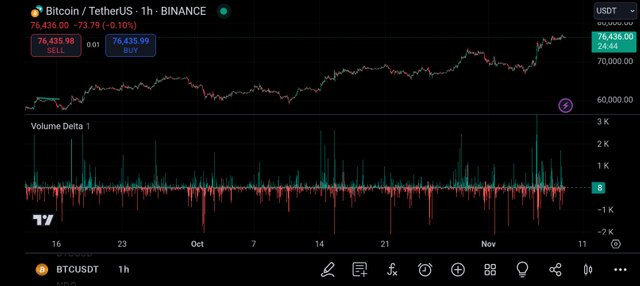
Via looking at the indicator we can see the following: high positive delta, high negative delta, and low or flat delta in the indicator as we have applied it.
High Positive Delta: This is the delta that signals strong buying pressure and may indicate a continuous bullish movement for us.
High Negative Delta: This is the delta that suggests selling pressure and may confirm a bearish trend for us.
Flat or Low Delta: This is the delta that informs us about a lack of volume or conviction in both directions, which often happens during the period of consolidation.
Components
- Delta: As we have discussed about this earlier, it is calculated as Buy - Sell volume over a specific timeframe. A positive delta means buying pressure is high, whereas a negative delta means selling pressure is high.

Buying Volume: This means the volume of trades that are executed at the ask price showing buyers are more willing to pay the sellers the price.
Sell Volume: This means the volume trades that are executed at the bid price showing sellers are more willing to accept the buyer price.
How Volume Delta Indicator is Use
There are three ways we can use the volume delta indicator which these three ways are;
Trends Identification: We can identify trends using the indicator that a consistent positive delta can suggest an uptrend as buyers are the people who are controlling the market, whereas a consistent negative delta suggests a downtrend meaning sellers are the people controlling the market.
Divergence: In identifying divergence, you will either see the price of the asset move up whereas the delta will decrease or increase, which suggests weakening strength in the current market.
Confirm Breakout: For a breakout, you will either see the delta spikes during a price breakout, which might signal string conviction among traders and investors.
https://x.com/AfenMary2746/status/1855122956910764216
Downvoting a post can decrease pending rewards and make it less visible. Common reasons:
Submit
This post has been upvoted by @italygame witness curation trail
If you like our work and want to support us, please consider to approve our witness
Come and visit Italy Community
Downvoting a post can decrease pending rewards and make it less visible. Common reasons:
Submit
Hi @jasminemary,
my name is @ilnegro and I voted your post using steem-fanbase.com.
Come and visit Italy Community
Downvoting a post can decrease pending rewards and make it less visible. Common reasons:
Submit
Note:- ✅
Regards,
@theentertainer
Downvoting a post can decrease pending rewards and make it less visible. Common reasons:
Submit
I actually think this is the first time I will be hearing about this delta performance and it is really a beautiful thing actually. Well let's hope that there will be a massive breakout
Downvoting a post can decrease pending rewards and make it less visible. Common reasons:
Submit