Be it crypto, forex, or trading the stock market, divergences means the instances where the price of an asset such as STEEM, BTC, BNB, Gold, etc, and the inductor you are using to analyze the asset moves in opposite directions providing you with signals about the weakness in the current trend of about the potential trend reversal of the asset.
Indicators like moving average, relative strength index, stochastic oscillator, and moving average convergence divergence are the most common inductors for checking divergence.
Using these inductors as a trader it would be much easier for you to spot divergence in your analysis. These inductors help one to observe momentum in the market.
Types of Divergence
Typically there are two (2) types of divergence which are: regular and hidden divergence.
Regular Divergence
This is the type of divergence that is split into bullish and bearish divergence which is for spotting for potential trend reversal.
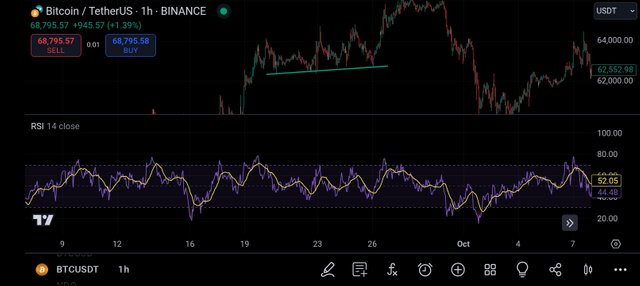
- Bullish Divergence:

Tradingview
In bullish you will see the price of an asset forms lower lows, but the indicator which you are using will be forming higher lows. This indicates that the downtrend momentum is getting weaker, and a bullish reversal is likely to take place.
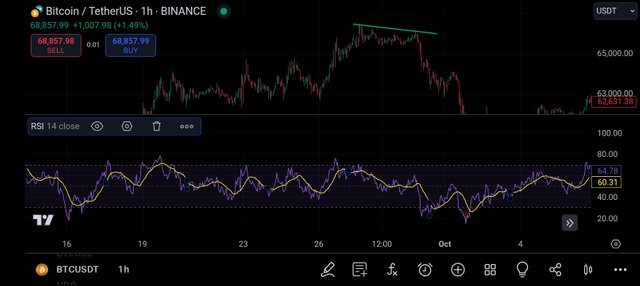
- Bearish Divergence:

Tradingview
In this divergence, you will see the price of the asset forming higher highs, but the Indicator you are using will be forming lower highs. This indicates that the uptrend momentum is getting weaker, and a bearish reversal is likely to take place.
Hidden Divergence
This is the type of divergence that is split into bullish hidden and bearish hidden which signal potential trend continuation and can be a sign that the current market trend may begin after a pullback.
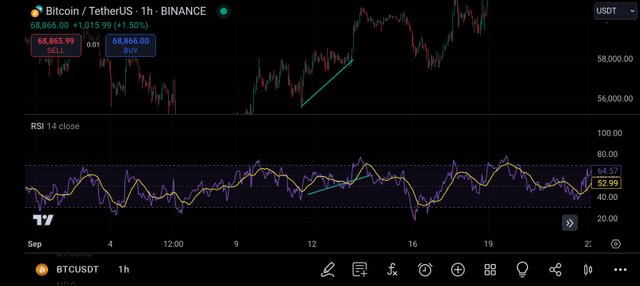
- Bullish Hidden Divergence:

Tradingview
In this, you will see the price of the asset making a higher low, but the Indicator you are using will be making a lower low. This indicates that the trend is still strong and it is likely to continue upward.
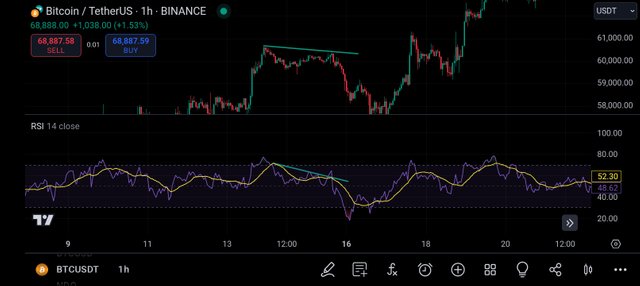
- Bearish Hidden Divergence:

Tradingview
In this you will see the price of the asset making a lower high, but the Indicator you are using will be making a higher high, indicating the trend may continue downward.
As a trader divergence can allow you to put eyes on potential reversals or continuations, which can work for you perfectly if you combine it with other technical indicators like volume, chart pattern, and others to confirm signals.
https://x.com/AfenMary2746/status/1853722448857899330
Downvoting a post can decrease pending rewards and make it less visible. Common reasons:
Submit
This post has been upvoted by @italygame witness curation trail
If you like our work and want to support us, please consider to approve our witness
Come and visit Italy Community
Downvoting a post can decrease pending rewards and make it less visible. Common reasons:
Submit
Hi @jasminemary,
my name is @ilnegro and I voted your post using steem-fanbase.com.
Come and visit Italy Community
Downvoting a post can decrease pending rewards and make it less visible. Common reasons:
Submit
Note:- ✅
KINDLY JOIN PUSSFI DISCORD SERVER FOR MORE DETAILS!
Regards,
@jueco
Downvoting a post can decrease pending rewards and make it less visible. Common reasons:
Submit
Great choice of topic I really learnt a lot from your explanation of divergence
Downvoting a post can decrease pending rewards and make it less visible. Common reasons:
Submit
Thank you.
Downvoting a post can decrease pending rewards and make it less visible. Common reasons:
Submit