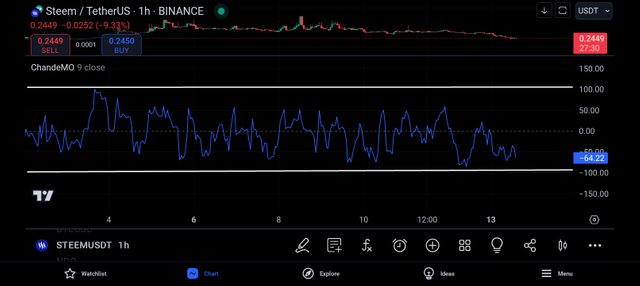
If you want to become good at analyzing the financial markets as a trader or investor, you must be good at interpreting and analyzing technical indicators. There are hundreds of thousands of indicators that are available on platforms like Tradingview which you can take advantage of before taking your market position. Here we will be discussing Chande Momentum Oscillator.
Chande Momentum Oscillator
You can as well called it CMO which is an abbreviation that is given to the name Chande Momentum Oscillator which is an indicator that helps traders, investors, and all those who are interested to know about the price movements of an asset to do so.
This indicator was introduced by Tushar Chande far back in 1994 in one of his publications to help traders measure the momentum of price movements of an asset. Also, it helps traders to identify the conditions of overbought and oversold and also the strength of a trend.
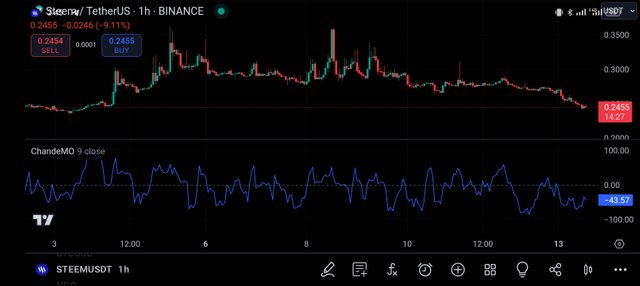
From the chart you are seeing, you will see that CMO oscillates between the range of +100 and -100, in which the +100 can be triggered when the market is in the condition of overbought, whereas the -50 is triggered when the market is an oversold condition
How to Find and Add CMO in Tradingview
Here we are going to be using Tradingview, because it is one of the most popular platforms that provide traders, and investors with thousands of indicators for analyzing the financial markets. Let's assume you have the Tradingview app installed on your phone all you have to do is to follow the given steps below 👇.
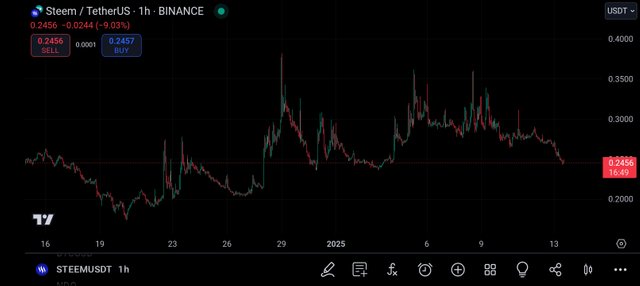
- Launch your Tradingview app and select the asset you want to analyze
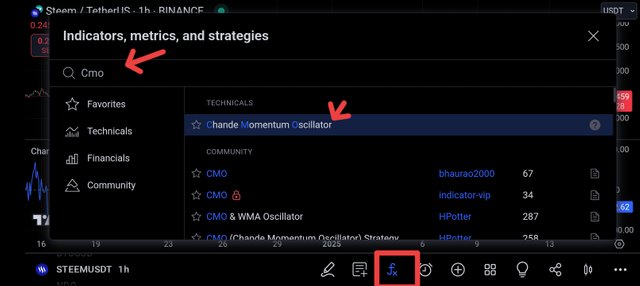
- Click on the FX sign and type the name CMO or in full in the search bar. Click on the name of the indicator once and exit back to your chart interface you will see the indicator
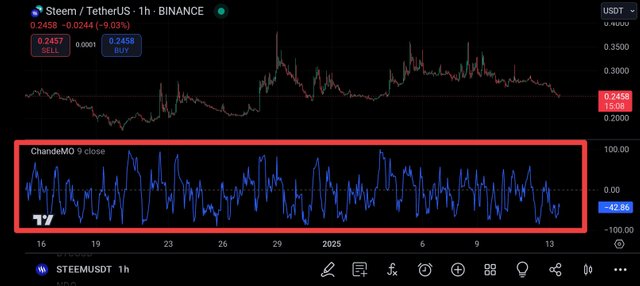
Calculation
In calculating the Chande Momentum Oscillator all you need is the formula to calculate the indicator. Below is the given formula used in calculating CMO
Chande Momentum Oscillator = ((UP – DOWN) / (UP + DOWN)) * 100
From the above formula; UP stands for the sum of all price gains over a specific period, whereas Down stands for the sum of all price losses over a specific period.
How to Use The Chande Momentum Oscillator
When using CMO you have to focus on identifying these three things which are: overbought and oversold condition, divergence, and trend confirmation. Let's talk about them briefly.

Overbought and Oversold Conditions: As we have discussed earlier we said that the +50 CMO means the market is overbought, whereas -50 CMO means the market is oversold. Overbought means buyers are interested, whereas oversold means sellers are interested the most than buyers.
Divergence: If you see the price of the asset you are analyzing moving in one direction but the CMO is moving in another direction it could signal a potential reversal which you have to look out for.
Trend Confirmation: When the CMO is above 0, it is an indication of upward momentum, but when it is below 0, it is an indication of downward momentum.
These are the key things CMOs help traders to identify in the market. However, to get better results or when you are not too sure about the market, you can combine the CMO with other indicators like the relative strength index to get a clearer view of the market before taking a position.
One Love to you and trade with caution as this is just an educational post written based on my analysis and study of the Chande Momentum Oscillator Indicator.
https://x.com/AkwajiAfen/status/1878818762625097970
Downvoting a post can decrease pending rewards and make it less visible. Common reasons:
Submit
Note:- ✅
Regards,
@jueco
Downvoting a post can decrease pending rewards and make it less visible. Common reasons:
Submit