The Standard & Poor's 500 Index (known commonly as the S&P 500) is an index with 500 of the top companies in the U.S. Stocks. Because the S&P 500 Index represents approximately 80% of the total value of the U.S. stock market, it’s the bellwether index for the U.S. stock market. In addition, the U.S. stock market is the largest stock market in the world, it’s also the bellweather for equity markets around the world. The S&P 500 is arguably the most important stock market index on the planet.

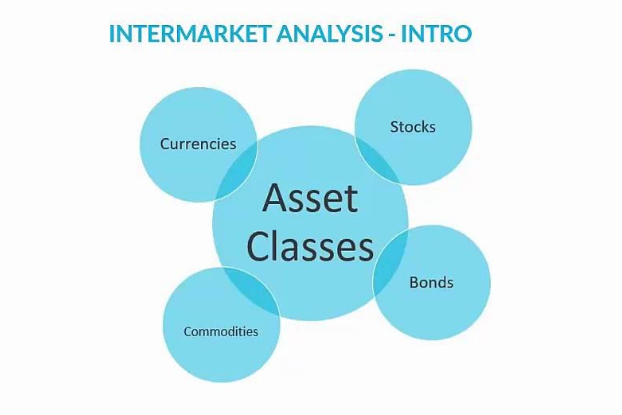
Instead of looking at financial markets or asset classes on an individual basis, intermarket analysis looks at several strongly correlated markets or asset classes, such as stocks, bonds and commodities. This type of analysis expands on simply looking at each individual market or asset in isolation by also looking at other markets or assets that have a strong relationship to the market or asset being considered.

The US economy is still the largest in the world and the US dollar is still the most powerful currency in the world. Over half of all foreign currency reserves in the world are in US dollars. Thus, the asset classes relative strength will be compared to the US Dollar.
Bitcoin

30 Yr Bond

Copper

Euro Dollar

Gold

Oil

Soybeans

S&P 500

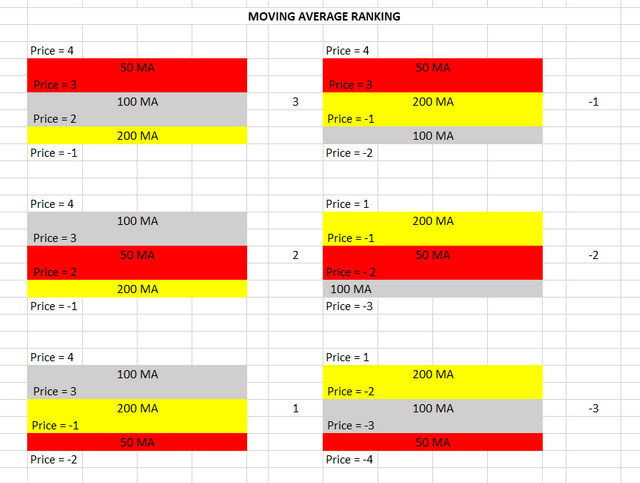
Based on the moving averages and the last daily closing price, relative to the moving averages,

the asset classes' relative strength, relative to the US Dollar are the following:

Two Weeks Ago

This post is my personal opinion. I’m not a financial advisor, this isn't financial advise. Do your own research before making investment decisions.

Posted via Steemleo