Let’s have a look at the parameters of a Bat pattern:
- Point B is at the 38.2-50% retracement of XA.
- Point C can be at the 38.2%-88.6% retracement of AB.
- Point D can be found at the 161.8%-261.8% extension of AB or at the 88.6% retracement of XA.
How to trade Bat pattern
- The entry is at the point D. As usual, a confirmation of the market’s reversal here is necessary.
- Take Profit may be at 38.2% of cd (TP1), 61.8% of cd(TP2), and/or the projection of XA from D100% (TP3).
- Put a Stop Loss below x point in line with your rules of risk management.

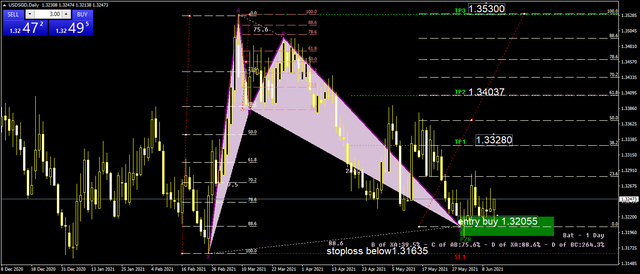
Let's have a look at the real time view of the bullish Bat pattern on the chart.
You can see that the point B is at about the 39.5% retracement of XA, the point C is at the 75.6% retracement of AB, while the point D is near the 88.6% retracement of XA. The Fibo ratios are not exactly the same as at the scheme, but they are close enough. Notice that a "harami" candlestick pattern was formed at the point D confirming the price's reversal to the upside.
Disclaimer
Our charts and contents are just for the purpose of analysis, learning and general discussion. Do not consider these as trading tips or investment ideas. Trading in forex market carry risk and is not suitable for every investor. Hence it is important to do your own analysis before making any investment or trading decisions based on your personal circumstances and it is always better to take your own decision.