What is a stock chart?
It’s simply a price chart that shows a stock’s price plotted over a time
frame, and it shows a few key sets of information:
Stock symbol and exchange
The symbol for the stock, as well as the specific exchange it trades on.Chart period
Typically daily, weekly, monthly, quarterly, or annually. Traders usually
concentrate on daily and intraday data to forecast short-term price
movements. Investors usually concentrate on weekly and monthly
charts to spot long-term price trends.Price Change
There are four key data points from a day’s trading: open, high, low, and
close. “Open” is the price at the start of the day and “close” is the price
at the end of the day. The “high” is the highest price during the session,
while the “low” is the lowest.Last Change
Displays the net change, positive or negative, from a previous price. On
a daily chart, it would be from the previous day’s close.Types of Charts
There are three basic types of charts used:
Line: Plots the closing price of a chart over time, helping you to see how
a price is behaving.
Bar chart: Plots the open, high, low, and close (OHLC) for each day using
bars.
Candle and stick chart: A visually appealing chart similar to a bar chart
that shows OHLC data in an easy way.Volume
Volume is the amount of stock that has been bought and sold within a
specific period of time. If a stock moves on low volume, it means that
few people are participating in the current price movement and the
trend may not continue. Meanwhile, if a stock moves on high volume, it
means many people are involved in the trade and the trend is more
likely to continue.
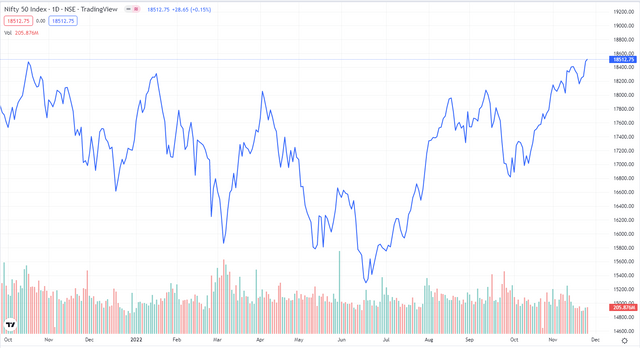
Line Chart

Candlestick chart
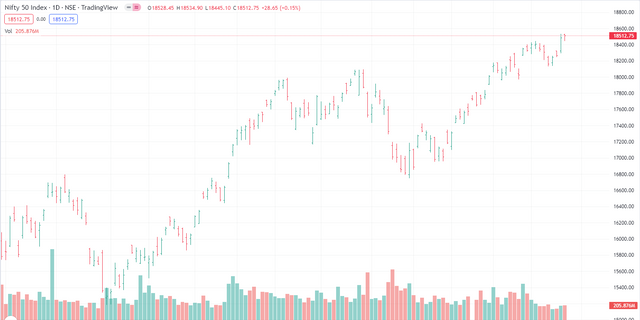
Bar chart
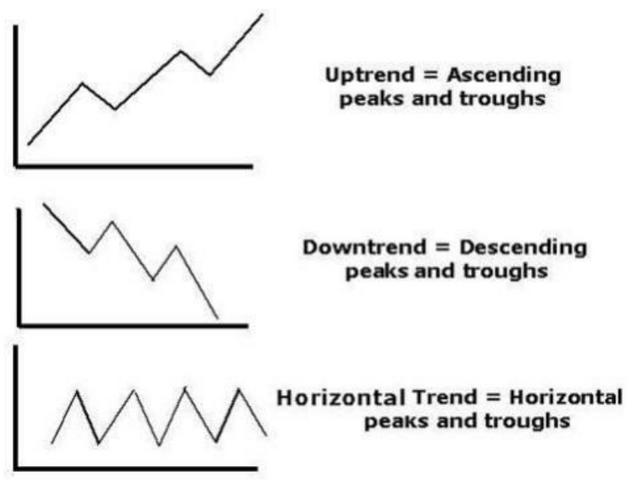
Tends on a chart :-
- Uptrend
- Downtrend
- Sideways

Support and Resistance:
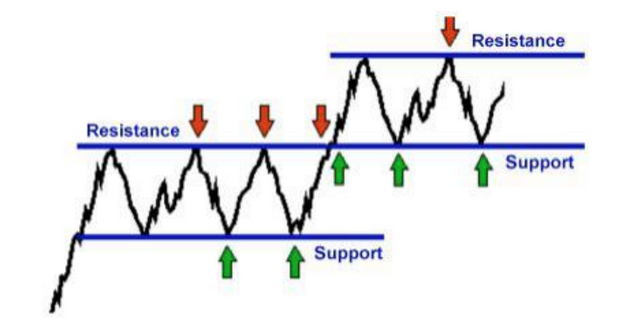
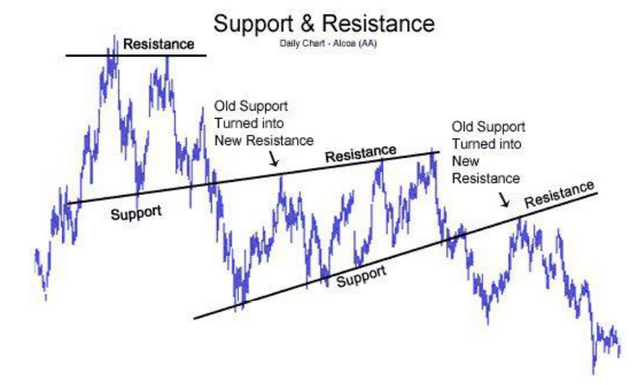
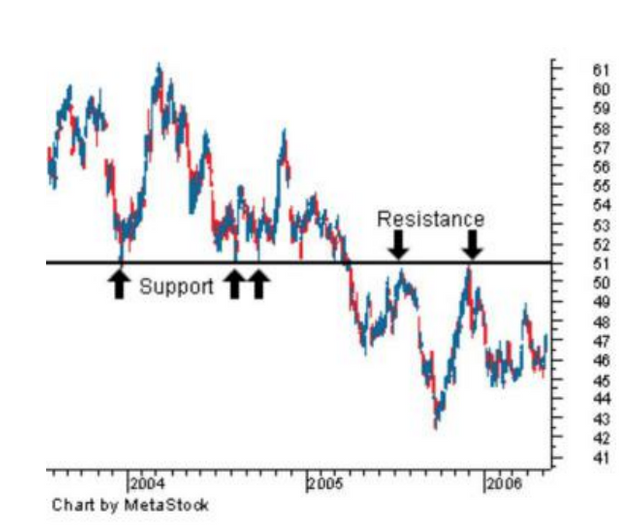
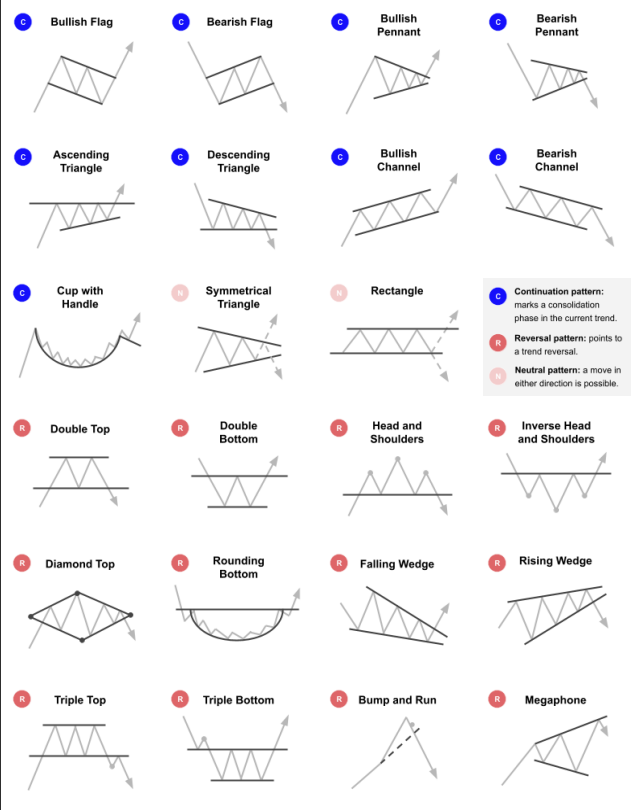
Chart Patterns
