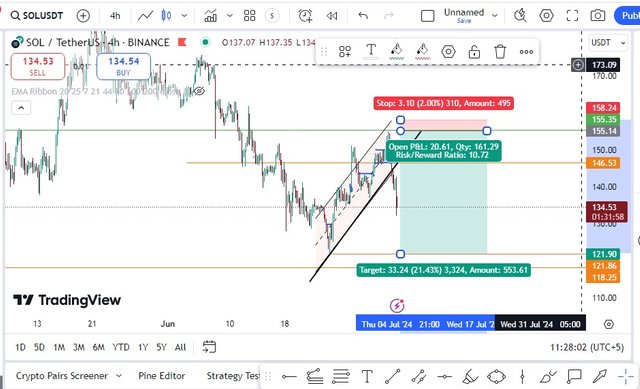
The chart below shows Sol SOL’s trading volume with USDT on Binance with a focus on a 4-Hour chart. The chart shows the price fluctuations with trading signals and other remarks made on the chart.

Price Levels: At the time of writing this paper, SOL is traded at around $137. 35. The chart reveals that a resistance level around 158$ is quite invulnerable. They indicated a resistance at $24 and a support level at $121. 90.
Trading Indicators: In this chart, the directions of the trend and potential reversal points are displayed by two EMA (Exponential Moving Average) ribbons.
Risk/Reward Setup: A trade setup is provided for a short trade, which has been denoted. Below it one can find the following data: The stop loss is set at $158. 24 while the target is at $121. 90. The risks for this trade over the reward is 10:1. 72; with a suggested potential for profit of $553. 61 and the corresponding risk amount is $495.
Timing: As for the trade setup is concerned, they are proposed to be opening from 4th of July, 2024 to 31 of July, 2024.
In general, the picture of further SOL development presented in this chart is rather negative, mainly due to the presence of a strategic short position in expectation of a decline to the support level.
Downvoting a post can decrease pending rewards and make it less visible. Common reasons:
Submit