As I had already told you, the OBV indicator is a very useful tool for predicting price movements based on the volume levels of assets, as it is governed by the principle that volume plays an important role in price movements and can be used to predict a possible change.

Edited image, original from pixabay.com.
And although the indicator can take positive and negative values, depending on whether the current closing price is higher or lower than the previous closing price, for the OBV the main focus should be on its direction, as this can indicate whether there is more buying or selling pressure in the market. Thus, if for a given cryptocurrency we observe that the OBV chart registers an increase, it is a sign that the trading volume is increasing during periods when the price rises, while, if it registers a decrease it is a sign that the trading volume increases during price falls.
How to use the OBV indicator
Traders who use this indicator generally use it as a strategy to confirm the market trend, mainly based on divergences between the price and the OBV.
In markets where we observe that the price trend is accompanied by an opposite movement in the line of the indicator, this is what we know as a divergence, and can be a strong signal that the price trend is about to reverse. Let's see how we can apply it with the OBV indicator.
Bullish divergence
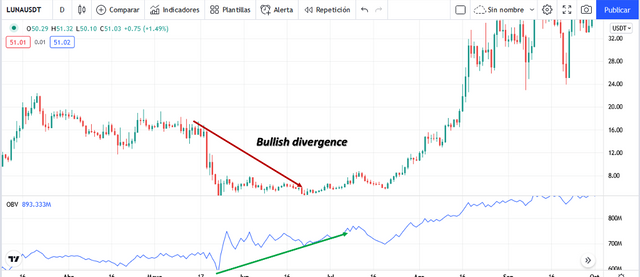
When in a bear market, we find that the price of a currency makes lower lows, but the OBV indicator makes higher highs, we are talking about a bullish divergence, and it is an indication that the strength of the sellers is running out and the bulls will take control.

Screenshot taken from Tradingiew.
In the image above, corresponding to the LUNA/USDT chart, we can see an example of this case. In the chart we can notice a period in which the price has been registering lower lows but the OBV indicator line is describing an upward direction, which would indicate that the sellers do not have enough strength and the selling pressure will take control of the market, and as we can see, after the divergence appears the price begins to follow the direction of the indicator starting a strong uptrend.
Bearish divergence
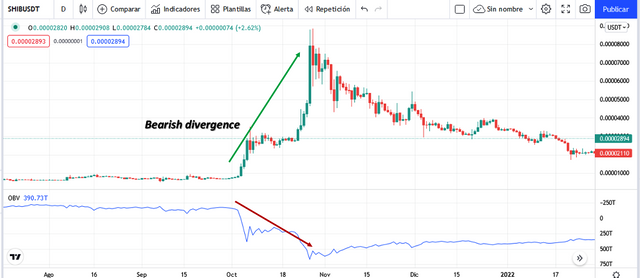
In this case, when we find a bullish market but we observe that the OBV indicator line makes higher lows, we speak of a bearish divergence, and it is an indication that the strength of the buyers is running out and the bearish will take control.

Screenshot taken from Tradingiew.
In the chart for the SHIB/USDT pair we can see an example of this theory, in the chart we can see a period in which the prices are in an uptrend, but on the contrary, the OBV indicator has recorded lower highs. And as we can see, this situation anticipates that the uptrend will not last long and there will be a reversal in the trend.
This type of signal is not very frequent but it is very reliable, we must also confirm these signals of the balance of volumes with additional indicators, which can be combined with moving averages or Bollinger bands, for further confirmation to find the best time to enter or exit the market.
Thanks for coming by to read friends, I hope you liked the information. See you next time.

Hi @amiliomoron, what a great explanation of how the OBV indicator works, that application of divergence is certainly very well detailed in the charts you present. thanks for such an important contribution.
Downvoting a post can decrease pending rewards and make it less visible. Common reasons:
Submit
hello @emiliomoron,
indicators always help to study patterns of behavior in the coins, but when the markets are very moved they are not very reliable. on the other hand, although an indicator cannot predict the future of a coin, what it can tell us is how the market is behaving. with this information we can guess patterns that can then be used to our advantage.
Downvoting a post can decrease pending rewards and make it less visible. Common reasons:
Submit
Hello @emiliomoron.
Technical indicators are of great help to make the best decisions in trading, now what we must achieve is to complement a series of indicators with which we manage to feel comfortable in our trading strategy, I will review this indicator is very interesting.
Downvoting a post can decrease pending rewards and make it less visible. Common reasons:
Submit