Already in another post I had told you about the indicator known as Keltner channels, an indicator that is formed by three lines, a central line that corresponds to an Exponential Moving Average (EMA), and two lines located at the same distance, one upper and one lower, which represent a deviation with respect to the central line, this deviation is calculated based on the Average Tru Range (ATR), which is an indicator that measures the volatility of the market. These characteristics make them very similar to Bollinger Bands, only that they use a Simple Moving Average (SMA) as the central line, and the upper and lower lines are plotted based on the standard deviation with the SMA.
And while it is a trend indicator, we will see that prices can interact with the bands of the indicator, establishing a kind of dynamic supports or resistances; and when we analyze the cryptocurrency markets, as well as it happens with other assets, we know that we must pay attention to the interaction of the price with the supports and resistances, because the price can do one of two things at these levels, bounce or break through them, and the latter is what we are interested in analyzing, the breaks.

Edited image, original from pixabay.com.
The Keltner channel can help us to identify these breaks, since we can see that during these breaks the bands of this indicator break, confirming this movement.
Bullish Breakout
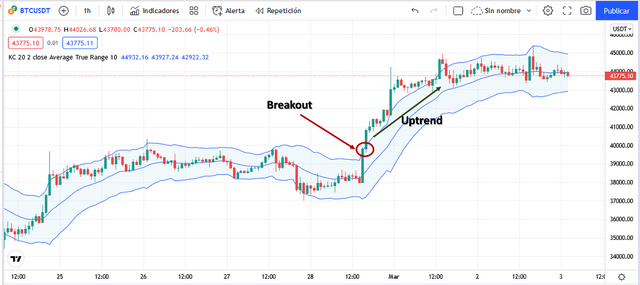
When there is a breakout of the upper band of the Keltner channel, which acts as a dynamic resistance, it is indicative of a bullish move. When we observe that a bullish candlestick breaks and closes above the upper line of the channel, it is a confirmation that this upward movement is going to continue, which should alert us to trade according to this movement. Let's see an example.

Example of a bullish breakout. Source: screenshot taken from Tradingview.
In the above image of the BTC/USDT pair we see that after a sideways movement, the BTC price breaks the upper line of the channel with a long green candle, and the next candle also closes above the upper line of the channel, which as we can see had acted as a resistance for a while; this movement confirms the uptrend that follows, so it is an important signal for the trader to keep in mind.
Bearish breakout
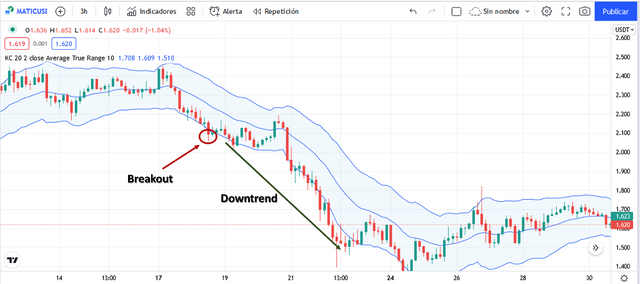
Now, a bearish breakout will take place when in a downward price movement, the price manages to fall and close below the lower band of the Keltner channel, which would be acting as a dynamic support, this is a sign that the downtrend will continue. Let's look at this situation on a chart.

Example of a bearish breakout. Source: screenshot taken from Tradingview.
In the image above, corresponding to the Matic/USDT price chart, we can see how prices are oscillating around the central line, then we see that they make an upward movement that bounces on the upper line of the channel and fall sharply, in its descent the lower line acts as support but we see how a bearish candle breaks the lower line of the channel and continues the downtrend.
Some principles for trading breakouts
As we saw in the previous charts, identifying a breakout in time can give us the opportunity to enter a market at the beginning of a trend, let's see some rules that can guide us to trade properly with Keltner channel breakouts and profit from the trade.
Trading with a bullish breakout
- When a range or reversal move occurs in the prices of the asset we are interested in trading, we must wait for the price to break above the upper line of the channel, which acts as our resistance.
- We must observe if the price is resisted at that point and goes back down, but remaining in between the center line and the upper line.
- If it moves within that region for a while, turning the EMA into a support, we will wait for the confirmation of two or three candles to make a market entry.
- And for a proper management we will place the Stop Loss just below the support (EMA), managing a 1:1 or 2:1 profit:loss range depending on the traded market.
Trading with bearish breakout
- Similar to the previous one, first we must visualize a range or reversal movement, only in this case we will wait for prices to move down and break the lower line of the channel, which will act as a support.
- Now we must observe if the price is resisted at that point, bouncing upwards but remaining between the center line and the lower line.
- If it moves within that region for a while, turning the EMA now into a resistance, we will wait for the confirmation of two or three candles to make a market entry.
- For a proper management of this trade, we will place the Stop Loss just above the resistance (EMA), managing a 1:1 or 2:1 profit/loss range depending on the market.

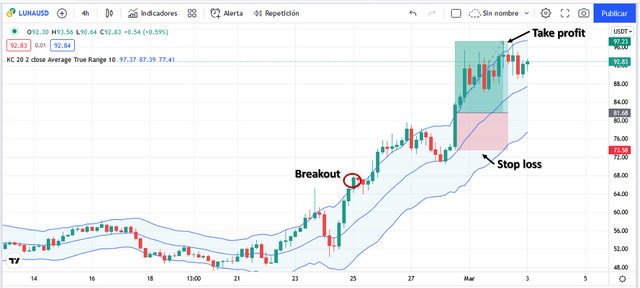
Example of a bullish breakout trade. Source: screenshot taken from [https://www.tradingview.com/x/pVmz77xw/).
In the chart of the LUNA/USDT pair we can see that prices come with a sideways movement, then they have an upward movement that at first is resisted by the upper line of the channel, but later prices manage to break this line, and when prices retrace we see that they bounce on the central line, this is the signal we expect to place our position, placing the Stop Loss just below the central line that acts as resistance and the Take profit with a profit range of 2:1.
As we can see, this indicator can not only be used to evaluate the current market trend but also to look for trading signals, so it is a good indicator to include in our trading strategy.
Thanks for coming by to read friends, I hope you liked the information. See you next time.
