The use of indicators allows us to analyze and have a clearer view of what is happening in the markets, many of us like them because they offer a visual reading much easier to interpret than the simple candlestick chart, although obviously they are not infallible, they allow us to obtain information with which to better support our decisions on how to operate in a market.
In this sense, today I bring you information about an indicator that I have found easy to interpret and that can alert us about overbought and oversold levels that lead to a turn in the market, this is the indicator known as Williams % R indicator or also known as Williams percent range indicator.

Edited image, original from pixbay.com.
This indicator, developed by Larry Williams, is an oscillator that determines the overbought or oversold state of an asset, it is very similar to the stochastic oscillator, only the Williams %R indicator has an inverted scale. This indicator reflects the closing price level in relation to the highest price for the selected study period, showing areas on the chart where the price trend could soon turn around.
In short, this indicator measures the ability of investors to get the price to close near the high or low of the period under study. Thus, it reflects periods where the selling or buying pressure increases, giving signals for traders to take a position in favor or against the trend.
The Williams %R indicator oscillates within a range between 0 and -100, with 100 being at the bottom, i.e., it takes negative values, although it is not necessary to consider it for the study. Values between -80% and -100% indicate that the asset is oversold, while values between 0 and -20% indicate that the market is overbought. Both zones are marked on the charts with two horizontal lines.
How is it calculated?
The formula for calculating the indicator is as follows:

Where:
CLOSE(i) = closing price of the day.
MAX(i-n) = the highest maximum recorded in period n
MI(i-n) = the lowest low recorded in the period n
The value of n corresponds to the length of the period selected for the analysis, however by default it is set to 14 periods, which can be hours, days, weeks or months depending on the configuration.
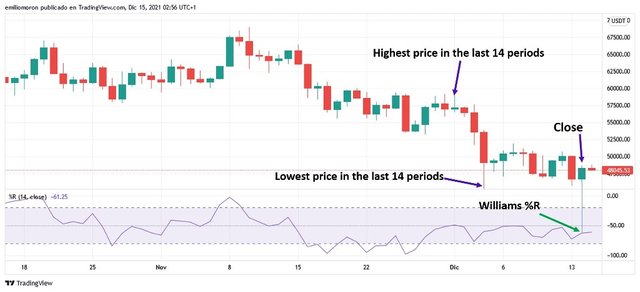
Let's assume that we are going to calculate the indicator for the BTC/USDT pair taking December 14 as the recent close and considering the data shown in the following image.

Source: Screenshot taken from Tradingview.
then

According to this result we can say that the asset has been trading close to its low values, a value below -80 would indicate that the price is very close to the minimum value reached in the last 14 days, while a value above -20 indicates that the price is closer to the highest price reached in the last 14 periods.
Configuration
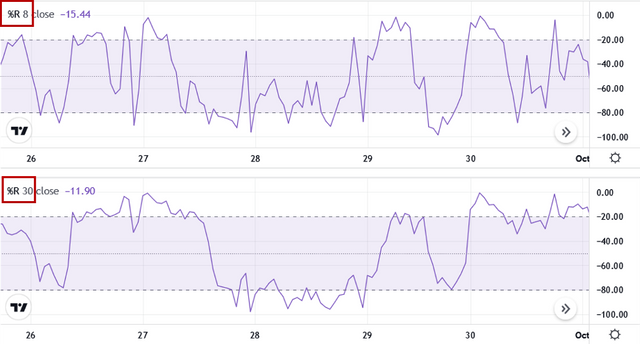
The configuration of the indicator in the TradingView platform has set by default the length in 14 periods, which has been recommended for most use cases, however this period can be adjusted at the discretion of the trader, and as I could review when configuring different lengths, is that while taking a number of periods greater than 14 the graph is smoothed, which would allow cleaning the graph of false signals especially for intraday trading. In the following images taken from the BTC chart, we can compare two graphs of the Williams %R indicator, for a length of 8 periods and another for a length of 30 periods.

Source: Taken from Tradingview.
As we can see there is less fluctuation in the signals when a greater number of periods is chosen, than when working with a period less than 14, correcting a little the sensitivity of the indicator.
On the other hand, the overbought and oversold zones are set by default at -20% and -80% respectively, these being the values recommended by the author.
How do you interpret the overbought and oversold signals?
As we have already mentioned before, these signals are very easy to interpret, we just need to be attentive if the indicator's chart crosses the horizontal lines of -20% and -80%.
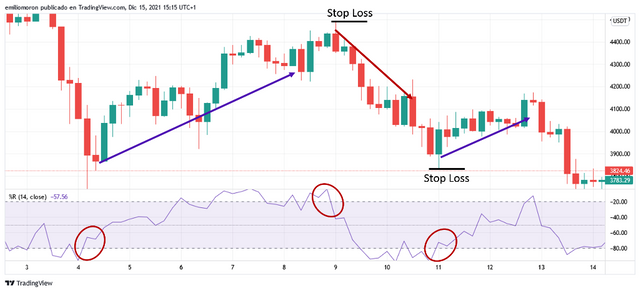
For example, in the following image we can see a price chart for the ETH/USDT pair with the 14-day Williams %R indicator, and how we can notice the overbought and oversold levels are reached on a regular basis.

Source: Screenshot taken from Tradingview.
When the indicator line crosses the horizontal line of -20% and goes to the area between 0 to -20% we say that the cryptocurrency is in an overbought state, when the indicator line escapes this area it is possible that there is a change of trend, so if the price was rising we recommend the sell trade, placing a Stop Loss above the high of that area. Otherwise, when the indicator line crosses the level of -80% is said and is located in the area between -80% and -100% we say that the cryptocurrency is oversold, if the indicator line leaves this area is a sign that a trend change is possible, and if the price was down it is advisable to buy, placing a Stop Loss below the nearest low.
However, there are circumstances in which defining a market as "overbought" or "oversold" can be a bit misleading, as false signals can also occur, so it is not advisable to use it as the only indicator to predict a trend reversal.
Another aspect to consider, is that it is difficult to estimate how long the market players can withstand the buying or selling pressure, we know that at some point the trend will reverse, but it is difficult to say when, i.e. when the indicator moves into the overbought or oversold zone it can oscillate several times around that zone, and we do not know exactly how long it can stay there.
Well friends, I hope you liked the information and help you to know a little more of the indicators that we can add to a technical analysis. See you next time!

Greetings @emiliomoron, definitely every technical indicator of trading is fundamental to be able to succeed in our operations, this indicator with your good explanation allows us to understand in a more efficient way the overbought or oversold in the market and to be able to make the best decision.
Downvoting a post can decrease pending rewards and make it less visible. Common reasons:
Submit
That's right my friend. Indicators are essential for trading, it is good to know them and apply the one that works best for our strategies. Greetings!
Downvoting a post can decrease pending rewards and make it less visible. Common reasons:
Submit
Hello dear friend @emiliomoron, I find this indicator very interesting, according to the explanation you made is very practical to visualize the market and making decisions when over selling and over buying. Thanks for sharing this kind of educational information for us newbies in trading.
See you later, have a great week.
Downvoting a post can decrease pending rewards and make it less visible. Common reasons:
Submit
Hello friend @amestyj. I also found it a very practical and easy to interpret indicator, and that can be very useful to help us in making decisions. Thanks to you for reading my friend, greetings!
Downvoting a post can decrease pending rewards and make it less visible. Common reasons:
Submit
@tipu curate
Downvoting a post can decrease pending rewards and make it less visible. Common reasons:
Submit
Upvoted 👌 (Mana: 4/5) Get profit votes with @tipU :)
Downvoting a post can decrease pending rewards and make it less visible. Common reasons:
Submit
Thanks my friend!
Downvoting a post can decrease pending rewards and make it less visible. Common reasons:
Submit