In our last publication, we detailed essential aspects in order to be a great trader. Now we will continue with the second part of this installment, so that everyone can have a good financial education and know the most important details of this profession that is trading.
Technical aspects of trading
In this second part I will deal with the technical aspects of trade, which we have:
Strategy
I am not going to bring in a definition of every single negotiating strategy, but I am going to focus on the one that carries out the trade, which is the trader, as well as the most important things that a strategy should have. There are many strategies that work, but it is the trader who has to make them work.
Indicators
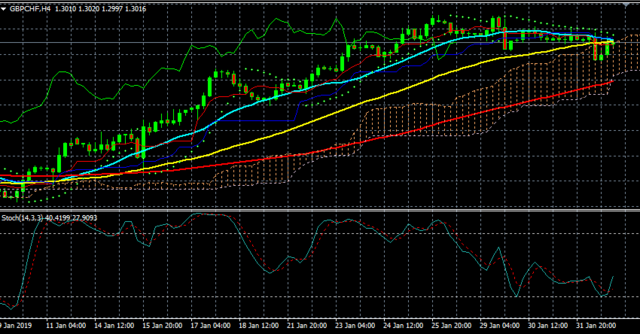
An indicator is roughly a figure that is drawn on the price chart and is calculated based on what the chart does. There are different types of indicators and each one "reflects" something about the market's behavior, for example: if the movement is weak or strong, or also if it is overvalued or undervalued, etc. A very common mistake made by people who are just starting to trade, is to believe that the more indicators we have on the screen, the better, since in theory we will have more certainty of what the price is doing. Let me tell you that this is not so, having many indicators on the screen will make the analyst much more confused.
Does it seem that seeing something like this makes any sense?

Screen print of the program called Metatrader4
As you can see, the price is easily camouflaged among so many indicators (I must confess it was a strategy I tried a few years ago).
What I want to say about indicators is that there are no magic indicators, you can't fall into the trap of thinking or believing, as there are many people who sell and say that one of them will tell you when they enter and when they leave the market. Don't look for magic, quick and meaningless solutions. There are no shortcuts, to be successful in business, as in anything else, you have to make an effort and be consistent.
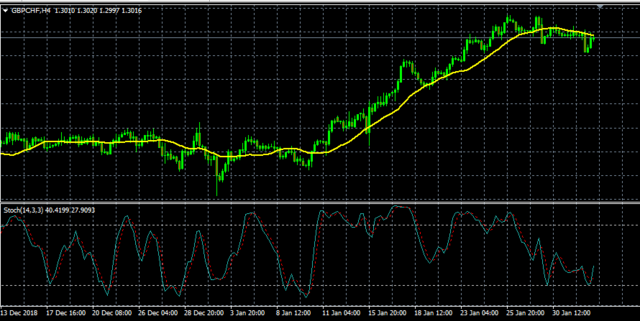
The third and last thing about indicators, is something that is obvious, but I do not want to stop clarifying it. As I said before, an indicator is calculated on the basis of what the price does, this means that, ALWAYS an indicator is going to be behind the price, in short, to show what it did in the past. And with all these aspects that I mention, I don't mean that the indicators are not useful, in fact, I usually use them, what I really want to recommend is that it is used only as a reference, just to confirm what the price reading is telling you. And for this, just a few indicators on the chart is more than enough.
Don't you think this makes more sense?

Screen print of the program called Metatrader4
Price action
Price action refers to specifically analyzing what the price does on its journey, without indicators. You can use some indicators to support your analysis, but you will find that, after a while and you won't need to. There is a lot of information about this on the web, that's why I want to clarify that you don't need to memorize the hundreds of chartist figures that there are, don't waste time with this, use the time to study the conditions that have to be given, according to the strategy you choose to trade.
Among the most important things that have to do with price action are supports and resistances, trend lines, up or down channels, trends, ranges, fractals, price strength or weakness, etc. I don't want to focus on defining each of these concepts because they are easy to find on the web, I want to focus on more important aspects that you won't find everywhere.
Choosing the time frame
The choice of the time frame is very important. The time frame, in general, is the time it takes for a Japanese sail to form its body. The important thing here is to know how to choose the time frame according to a number of aspects:
Time:
If you choose a small time frame, you have to be in front of the screen to check the market and in that time you can't do other activities. You must organize and think, if you can spend some of your time just to do this task. On the other hand, if you choose a larger time frame, perhaps reviewing the charts 3 or 4 times a day will be enough. You will have to adapt your choice of time frame to your time availability.
Number of operations:
If you choose small time frames, you can most likely have several trades per day, but if they are larger, you can only have a few trades per week, the question is do you want to get in and out of the market quickly or do you prefer to have a trade open for days or even weeks?
Your personality:
Are you impatient or patient people? In large time frames, you may have to be patient to find opportunities in the market and you will need to be patient to see how the operation turns out. At this point you have to think about what situation you are going to feel most comfortable in.
Clarification:
No single time frame is easier or more difficult on its own, it all depends on your personality and how you adapt. It is common for people who are starting to trade to think that in the bigger time frame they earn more because the price makes longer recordings, this is incorrect, due to aspects that must be taken into account regarding risk management that we will see later.
Recommendation:
You should always wait to enter the market to close the candle, select the time frame you have chosen to trade, because if all the analysis about the past is done with candles and finished, why make a decision with a candle in formation? Simply put, if you trade on 1 hour charts, you must make decisions when the 1 hour candle closes, on 4 hour charts you must only look at the charts and make decisions every 4 hours, and so on, this prevents you from entering the market with many false entries.
For now we have reached the end of this post, in the next part we can learn more about the methodology and money management, undoubtedly very important aspects to take into account in this trade called trading.

Consider joining our community on Discord


Which indicators are the best for cryptocurrency from you own point of view?
Downvoting a post can decrease pending rewards and make it less visible. Common reasons:
Submit
Greetings, sorry I'm late in responding to your comment @chesatochi
In my personal opinion, the best indicators that have been adapted to my operation are:
Moving averages
RSI
Pivot points
The Fibonacci Studies which although not indicators as such, are very good, such as the Fibonacci regressions, the range and the extension.
Volume profile
Downvoting a post can decrease pending rewards and make it less visible. Common reasons:
Submit
Thank for the answer, it is been a long time I posted this comment. ;)
Downvoting a post can decrease pending rewards and make it less visible. Common reasons:
Submit
@tipu curate
Downvoting a post can decrease pending rewards and make it less visible. Common reasons:
Submit
Upvoted 👌 (Mana: 4/16 - need recharge?)
Downvoting a post can decrease pending rewards and make it less visible. Common reasons:
Submit