It is assumed that failure oscillations, or oscillatory failures as they are also called, are events that project a probable trend reversal, where a peak fails to surpass the one that preceded it.
Now, in this entry I brought some examples using the Williams% R Indicator, and it is essential to keep in mind that the overbought or oversold signals revealed by the Williams% R Indicator, do not necessarily indicate that a particular trend in the market is about to culminate, especially if you begin to observe oscillations of failures within the Williams% R Indicator.
Oscillatory Failures / Williams% R Indicator / Uptrend
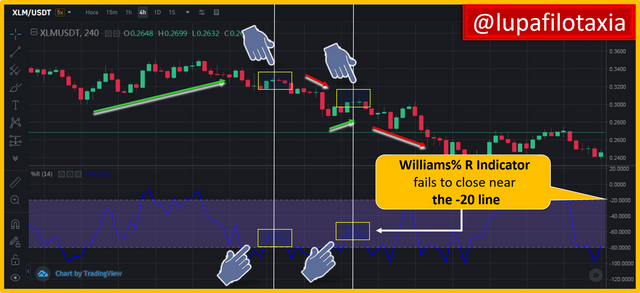
To project an "oscillation failure" in an uptrend using the Williams% R Indicator, note in the following image that even though XLM's price action is in an uptrend, the indicator fails to rise above its high reference line estimated at -20, which reveals a sign of weakness in the uptrend and a probable reversal to a bearish zone, so it can be interpreted as a sell signal.

Oscillatory Failures / Williams% R Indicator / Downtrend
To project a bearish "swing failure" using the Williams% R Indicator, note in the following image that even though STEEM's price action is in a downtrend, the indicator fails to fall below its -80 line, which reveals a sign of weakness in the downtrend and a probable reversal to an uptrend, so it can be interpreted as a buy signal.


OBSERVATION:
The cover image was designed by the author: @lupafilotaxia, incorporating image background: Source: daytradetheworld


@tipu curate 2
Downvoting a post can decrease pending rewards and make it less visible. Common reasons:
Submit
Upvoted 👌 (Mana: 0/5) Get profit votes with @tipU :)
Downvoting a post can decrease pending rewards and make it less visible. Common reasons:
Submit