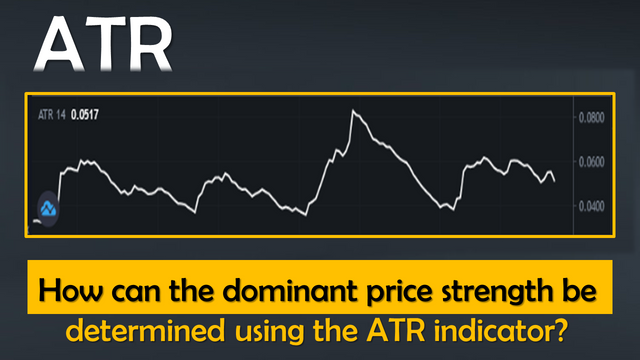
Greetings friends of @Project.HOPE, in this new post about technical information related to the ATR indicator, I wanted to share with all of you how to know the price volatility and how you can determine the dominant strength of the price using the ATR indicator, this with the aim of continuing to contribute in the socialization of technical content that allows us to improve our trading strategies.
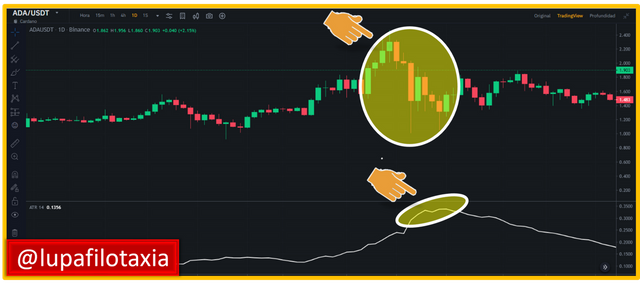
Well, going into the subject, it is worth noting that one of the easiest ways to know the price volatility using the ATR indicator, is by comparing the price action and the movement of the ATR indicator line, therefore, when after a certain stability the candles start to move significantly, and if the ATR changes rapidly forming peaks, this can be interpreted as an increase in price volatility.
In the following example, you can visualize in the ADA/USDT pair note how as the candles move significantly downward, the ATR indicator line moves rapidly forming high peaks, an action that reveals the high price volatility.

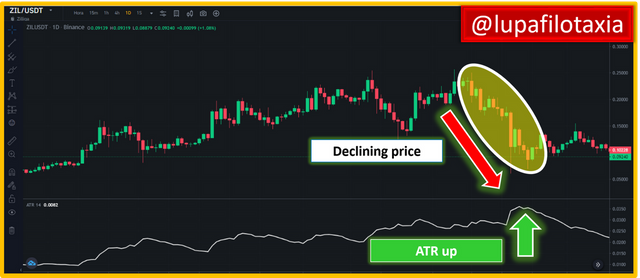
In relation to how to determine the dominant force of the price, and starting from the fact that the ATR indicator is based on the rule that strong trends necessarily correspond to values of high volatility, then the dominant force on the price in most cases does not coincide with the direction of the line of movement of the ATR indicator.
In the following example, notice how in the ZIL/USDT pair how the ATR indicator line rises as the price falls, revealing that the dominant force is bearish.

As you may have noticed with the two examples shown in this publication, the ATR indicator gives us high probabilities of knowing the dominant strength of the price direction either in a bullish, bearish or ranging direction.
I hope that the information shared here has been of great help, in the next publication we will talk about how to use the ATR indicator to manage commercial risk.

SOURCES CONSULTED
Cory Mitchell How Average True Range (ATR) Can Improve Your Trading. Link

OBSERVATION:
The cover image was designed by the author: @lupafilotaxia, incorporating image: TradingView


Well, I leave the technical guys to handle this. i was lost as the analysis began, I believe it will take me a week or two to learn all the technical parts of chart reading and trading. Regardless, thanks for sharing
Downvoting a post can decrease pending rewards and make it less visible. Common reasons:
Submit
Hi @lebey1
lol you may not take two weeks, if you go to the first posts I uploaded about ATR it will be easy for you to understand how it works.
Best regards, be well.
Downvoting a post can decrease pending rewards and make it less visible. Common reasons:
Submit
@tipu curate
Downvoting a post can decrease pending rewards and make it less visible. Common reasons:
Submit
Hi @alokkumar121
Thank you for this support. Blessings to you and yours.
Best regards, be well.
Downvoting a post can decrease pending rewards and make it less visible. Common reasons:
Submit
Upvoted 👌 (Mana: 0/6) Get profit votes with @tipU :)
Downvoting a post can decrease pending rewards and make it less visible. Common reasons:
Submit