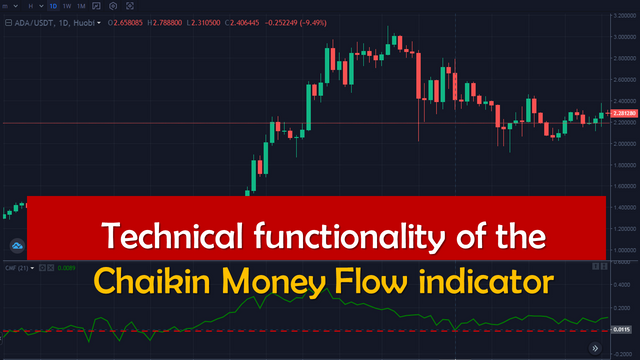
In the world of trading projecting the volume of money flow is not easy, however, the advantage is that there are indicators such as the Chaikin Money Flow (CMF) tool that provide us with the facility to measure the volume of money flow during a specific period, in this sense with this post I will be starting a series of posts on how to measure the volume of money flow.
It should be noted that the Chaikin Money Flow indicator was developed by the famous founder of the Chaikin Analytics trading platform and very popular stock analyst Marc Chaikin, who set himself the goal of creating a technical indicator that could measure the volume of money flow during a specific period.
Marc Chaikin, in developing the CMF indicator, made the premise that if the stock closes near the high of the session with higher volume, the Chaikin Money Flow indicator will increase in value, while if the price action closes near the low of the session with higher volume, the Chaikin Money Flow indicator will decrease in value.

Specifically, the technical functionality of the Chaikin Money Flow indicator consists in determining whether the price action of a financial asset is in an accumulation or distribution zone, by comparing the closing price with the maximum-minimum range of the trading session.
The implicit variables of the CMF indicator are derived from simple statistical elements that allow us to project the momentum, trend strength, and liquidity of a given market.
One of the key elements of the Chaikin Money Flow indicator is that it graphically provides visual data that provides guidance on the buying or selling pressure of a security in a given period.
Strength or weakness of price action
The CMF indicator is based on the fact that if the closing price is close to the maximum, an accumulation is evident, while if the closing price is closer to the minimum, a distribution occurs, behaviors that serve as technical guidance to determine the strength or weakness of the price action of a financial instrument.
Reversals or trend breaks
On the other hand, the CMF indicator, in addition to projecting the strength or weakness of the price action of a financial instrument, also serves as a guide to possible trend reversals or breaks.
Key signals revealed by the CMF indicator
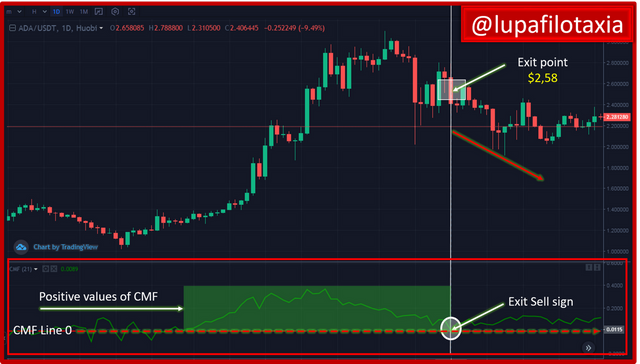
The fundamental signals provided by the CMF technical indicator is that if the indicator is above zero (0) it is interpreted as a bullish signal, while a reading below zero (0) is interpreted as a bearish signal.
In the next publication we will talk a little about how to calculate the value of the CMF indicator.

SOURCES CONSULTED
Tradingsim Chaikin Money Flow Indicator Review. Link

OBSERVATION:
The cover image was designed by the author: @lupafilotaxia, incorporating image: Binance

