Hello @Project.HOPE friends, as I have mentioned before in the world of cryptocurrency trading, one of the insecurities that users face every day, is precisely how to capitalize or rather how to make more profits in the volatile cycles that are experiencing a particular market.
In this sense, one way to reduce the insecurities that traders face on a daily basis is to include in their strategies technical indicators that measure or project market volatility, in order to be able to find signals that give a more precise orientation that allows them to take a much more efficient position.
Therefore, indicators that project market volatility are essential technical analysis tools that allow us to set take profit or stop loss levels, hence, in this post we will focus on socializing key aspects of the Average True Range Indicator (ATR).
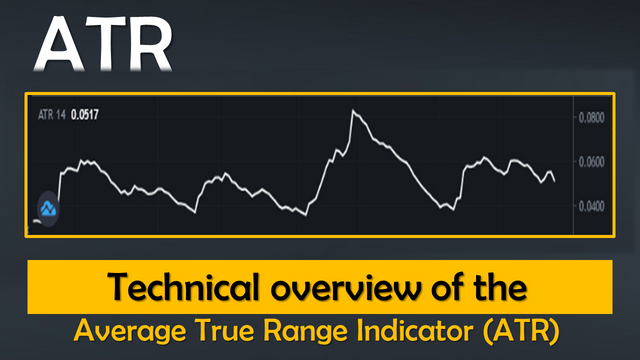
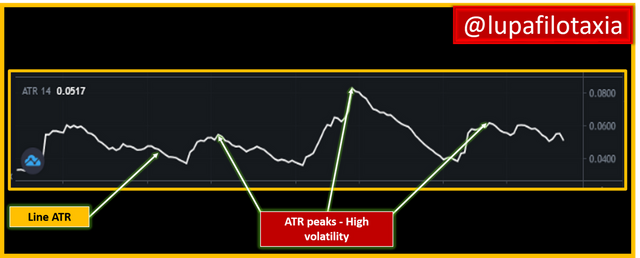
The Average True Range Indicator or ATR is an oscillator, which means that it moves in waves and peaks. However, the ATR, unlike the rest of the oscillators, has the particularity of projecting the volatility of the market in the price movement.
A point to note is that the ATR as the price action makes larger or smaller movements either up or down, the average true range indicator becomes larger or smaller, an action that reveals the volatility of the financial instrument.

Theoretically, it is assumed that the average of a financial instrument is directly proportional to its volatility, therefore, if the volatility of a stock increases, the ATR indicator serves as a guide to determine that the stock is entering a trend, and on the contrary, if the average of the true range slows down, it indicates a change in trend.
Formula to determine the ATR
The following formula is used to determine the ATR:
Current ATR = ((previous ATR * 13) + current TR) / 14

How ATR is calculated
Now, in order to calculate the Average True Range Indicator (ATR), a series of averages must first be known, namely:
Current high - previous close
Current high - current low
Current low - previous close
Example of how to calculate the current ATR value
In this segment, I will exemplify how to determine the ATR by considering the following data:
Data:
Current high: 578
Current minimum: 570
Previous closing: 545
Solution:
Current high - previous close = 578 – 545
Current high - current low
= 578 - 570
Current low - previous close
= 570 - 545
Result:
Current high - previous close = 33
Current high - current low
= 8
Current low - previous close = 25
☑ Current ATR = ((33 * 13) + 8) / 14 = 31,21
In the next post I will share with you all some trading strategies using the ATR indicator, and how we can take entry and exit points by incorporating other indicators that decrease the noise on the chart and increase our probabilities of hits.

SOURCES CONSULTED
Cory Mitchell How Average True Range (ATR) Can Improve Your Trading. Link

OBSERVATION:
The cover image was designed by the author: @lupafilotaxia, incorporating image: TradingView


hello @lupafilotaxia,
Personally I did not know this indicator, but I find it interesting that it can help me to establish a pattern of movement in the market with which I will limit the risks in each operation, on the other hand since I started in the world of cryptocurrencies, the indicator that I use the most are the bollinger bands, it is possible that this indicator can complement the one I already use.
Downvoting a post can decrease pending rewards and make it less visible. Common reasons:
Submit
Hello @trabajosdelsiglo
I like to use Bollinger bands, over time I have learned that to decrease noise on charts. we should add additional indicators to our trading strategy.
Best regards, be well.
Downvoting a post can decrease pending rewards and make it less visible. Common reasons:
Submit
@tipu curate 2
Downvoting a post can decrease pending rewards and make it less visible. Common reasons:
Submit
Upvoted 👌 (Mana: 4/6) Get profit votes with @tipU :)
Downvoting a post can decrease pending rewards and make it less visible. Common reasons:
Submit
Hello @alokkumar121
Again I am thankful with the support you provide.
Best regards, be well.
Downvoting a post can decrease pending rewards and make it less visible. Common reasons:
Submit
Hello @lupafilotaxia!
I've never heard or used this indicator before yet it seems to be really helpful when it's about indicating change in trends or trends getting tired and almost coming to an end. As I could say it's not always pretty easy to catch trends from the very first or notice a change in the trend without studying the chart carefully.
Thanks for sharing!
Downvoting a post can decrease pending rewards and make it less visible. Common reasons:
Submit
Hi @lennyblogs
It is certainly very useful when it comes to indicate a change in trends, hope you can use it and share your experience.
Best regards, be well.
Downvoting a post can decrease pending rewards and make it less visible. Common reasons:
Submit
Hi @lupafilotaxia it is nice to know about ATR
though I am more inclined towards the more conventional indicators however I see this as a good way to be be better informed before entering a trade.
The hard work that you have put in shows and makes this post enjoyable, informative and easy to understand.
Good luck to you!
@thetimetravelerz
Downvoting a post can decrease pending rewards and make it less visible. Common reasons:
Submit