Greetings dear friends of @Project.HOPE, in the development of the previous posts on the ROC indicator we have learned that ROC is a very useful technical momentum tool, which registers positive readings above the zero (0) line when the price action makes high peaks, likewise it registers negative readings below the zero (0) line when the price action makes low peaks.
With this post we conclude the series of posts on the ROC indicator, but first we will explain how to interpret the following signals incorporating other technical indicators, namely; short EMA, long EMA and volume.
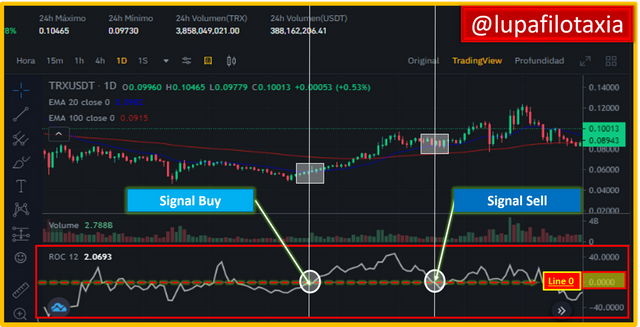
Signal to buy/sell
Let's see examples of buy and sell strategies in the TRX/USDT pair using the ROC indicator, it is to emphasize that to reduce the noise in the readings I attached other technical indicators to the strategy, among these; EMA of 20 periods, EMA of 100 periods, and volume

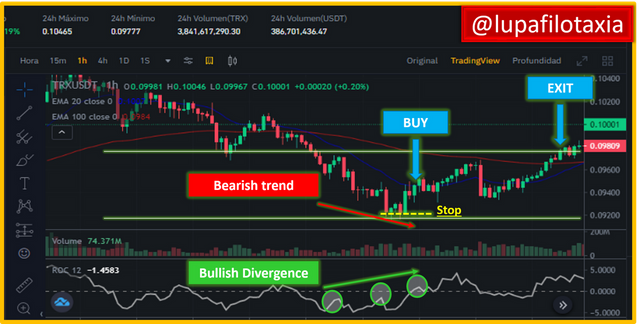
Bearish/upward trend change
In the chart below notice, that the price action is making lower lows after a prolonged downtrend, while on the contrary the Rate of Change indicator is making higher highs, an action that can be considered as a bullish divergence signal from the ROC indicator, therefore, prices in the TRX/USDT pair started to reverse the downtrend and move higher.

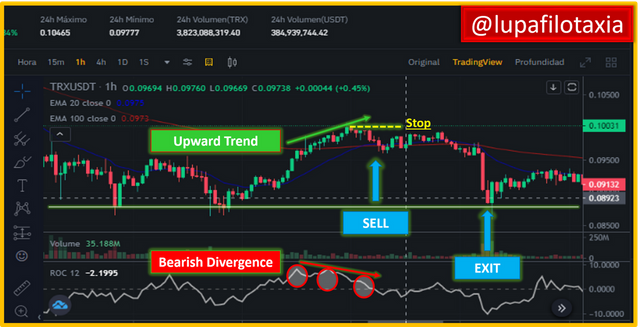
Upward/bearish trend change
En la sección superior del siguiente gráfico, se puede visualizar que la acción del precio venía haciendo máximos más altos, esto se puede contrastar si detallan línea verde ascendente que coloqué para conecta los picos máximos alcanzados, ahora bien, if you look in detail at the lower segment of the chart you will notice a descending red line that I placed to connect the minimum peaks reached by the Exchange Rate indicator, action that in itself traced a bearish divergence formation between the price and the ROC indicator, therefore, prices in the TRX/USDT pair began to reverse the uptrend and go down.

To close this post, it is necessary to remind you that the Rate of Change or ROC indicator is an indicator that helps to determine the strength of a trend, therefore, it is considered within the category of technical indicator based on momentum.
On the other hand, the ROC indicator, in addition to helping us determine the strength of a trend, also provides technical information that serves as a guide to the weakness and probable change of a trend.

SOURCES CONSULTED
Cory Mitchell Price Rate Of Change Indicator (ROC). Link

OBSERVATION:
The cover image was designed by the author: @lupafilotaxia, incorporating image: Coinmarketcap


Since I keyed into cryptocurrency, trading is something I haven't not given attention at all. I just don't know why I have little or no interest in it. I will try my possible best to look more into it with time. I love your trading strategies.
Downvoting a post can decrease pending rewards and make it less visible. Common reasons:
Submit
These indicators are looking very useful. I wonder how many people are actually using this. I must admit that I never had the time to get into the technical analysis that deep. So that's great that you are able to provide us with such important and interesting articles! :)
Downvoting a post can decrease pending rewards and make it less visible. Common reasons:
Submit
Thanks for sharing about ROC indicator it proof to be a very useful tool used to analyze market price trend.
Downvoting a post can decrease pending rewards and make it less visible. Common reasons:
Submit