Introduction
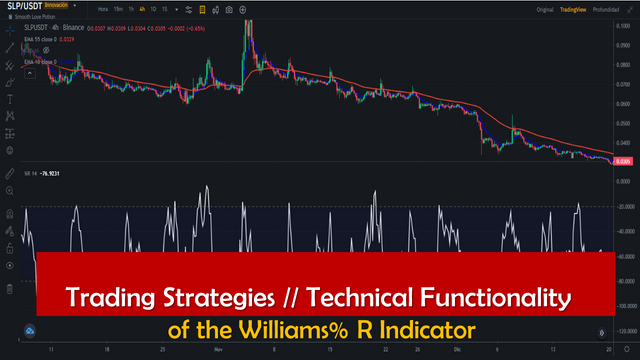
With this post, I will continue sharing content on trading strategies, today I will describe some aspects of the Williams% R Indicator, this indicator is one of the classic indicators within the technical analysis widely used as a simple oscillator, which serves to identify the areas of selling pressure and buying pressure, and the most convenient potential entry and exit points, as it also works as a momentum indicator.
This classic technical analysis tool, the Williams% R Indicator, was devised by the famous American trader Larry Williams, on the other hand, it is important to note that the Williams% R Indicator correlates with the stochastic, and with the Relative Strength Index or RSI for its acronym in English, so it is intuitive that reveals graphic readings that work similarly to the two indicators already mentioned.
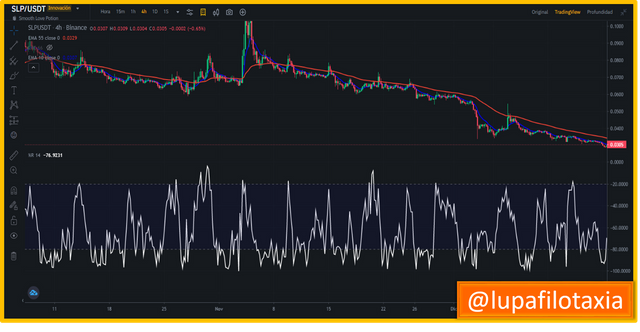
The graphical readings revealed by the Williams% R Indicator serve as a guide to determine which segment of the market is in control (bullish/bearish), taking into account that, when the indicator is above -20 approaching 0, this indicates that the bullish traders have reached their maximum strength, and in the opposite case, when it approaches -100 it indicates that the bearish have reached their maximum strength, and decide to close prices at the minimum of the period.

One of the most outstanding technical functionalities of the Williams% R Indicator, is that it can be executed in predetermined configurations of (n) periods in any timeframe; hourly, daily, weekly, monthly or any other period of time of the trader's preference.
Another functional element of the Williams% R Indicator is that the value of this tool fluctuates in a range from 0 to -100, values below -80 represent a signal that the financial instrument is under selling pressure, therefore, there is a probability that the price will increase.
At the opposite extreme, i.e. when values are above -20 and projected to 0, this can be interpreted as a sign that the financial instrument is under buying pressure, therefore, there is a probability that the price will depreciate or fall.

OBSERVATION:
The cover image was designed by the author: @lupafilotaxia, incorporating image background: Source: Binance


I don't ususallly believe in indicators because it always have it's own downside. I reading the chart should be more than enough that applying indicators. Though William can also be a useful tool sometimes when determining the entry of a trade but not every time
Downvoting a post can decrease pending rewards and make it less visible. Common reasons:
Submit
neither do I @mandate
truth be told, I don't usually like to give to much attention to all those indicators and I rather focus on simple ones like price+volume action and establishing where we have line of support and resistance.
More indicators = more headache hahaha. And more dilemas, frustration and confusion. That's my impression anyway.
Downvoting a post can decrease pending rewards and make it less visible. Common reasons:
Submit
Hello @mandate
You may be right in your arguments, as indeed each indicator has its disadvantages, that's why I like to incorporate more than one indicator in my trading strategy, in the quest to increase my chances of success.
Best regards, be well.
Downvoting a post can decrease pending rewards and make it less visible. Common reasons:
Submit
Greetings @lupafilotaxia, knowing more and more about different analysis tool allows us to improve in our operations, as everything is advisable to use these indicators together in search of confirmations of entries or exits. Valuable delivery
Be well and have a great Christmas.
Downvoting a post can decrease pending rewards and make it less visible. Common reasons:
Submit
Hi @madridbg
I agree with your point of view, in fact I like to incorporate more than one indicator in my trading strategy, in the quest to increase my probabilities of success.
Best regards, be well.
Downvoting a post can decrease pending rewards and make it less visible. Common reasons:
Submit
Interesting choice of topic @lupafilotaxia.
I've surely never heard about this particular indicator.
I surely found this post worth reading and it never hurts to learn something more. However ...
truth be told, I don't usually like to give to much attention to all those indicators and I rather focus on simple ones like price+volume action and establishing where we have line of support and resistance.
More indicators = more headache hahaha. And more dilemas, frustration and confusion. That's my impression anyway.
Have a pleasent sunday buddy. Upvote on the way :)
Yours, Piotr
Downvoting a post can decrease pending rewards and make it less visible. Common reasons:
Submit
Hi @crypto.piotr
Certainly the more indicators we attach the more confusion will be generated, even more disorder at the graphical level, however, I like to incorporate more than one indicator in my trading strategy, in the search to increase my chances of success, plus knowing the technical functionality of multiple indicators is a plus when you want to get out of doubt.
Best regards, be well.
Downvoting a post can decrease pending rewards and make it less visible. Common reasons:
Submit