Will TRUMP Coin Continue Its Rise? Or Is a Fall Imminent?
Technical analysis shows that the #TRUMP token is in the overbought zone. As of now, the Relative Strength Index (RSI) is at 98.88. This shows that the market's interest in TRUMP is unusually high.
The RSI measures whether an asset is overbought or oversold. Values above 70 indicate that the asset is in the overbought zone, while values below 30 indicate that it is in the oversold zone. TRUMP's RSI at 98.88 increases the possibility of a price correction.
The TRUMP token market is experiencing major fluctuations. The Average True Range (ATR) indicator has reached 6.20. ATR measures the price range of an asset over a certain period, indicating volatility. An ATR at this level indicates that price movements can be very sharp and sudden changes in direction can be seen.
Speculative investor movements, especially in meme coin markets, can further increase price volatility. Investors need to be careful at this point.
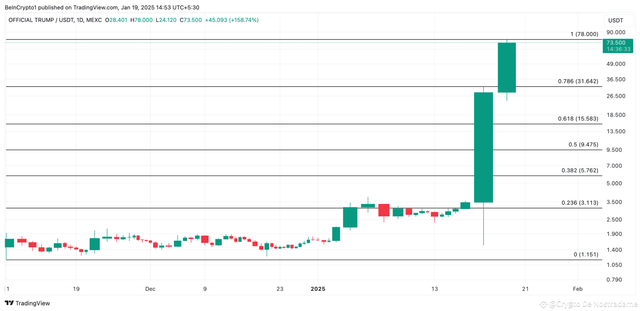
According to technical analysis, the TRUMP price may decline to $ 31.64 according to the Fibonacci Correction Tool. If buyers lose power at this point, there is a risk that the price may decline to $ 15.58. However, if demand continues and large investors maintain their interest, TRUMP may form a new peak. In this case, the price may rise above its current level and retest the all-time high.
The critical point for investors is whether the market can maintain its current momentum. If demand weakens, a sharp correction may be inevitable. However, if the market recovers, #TRUMP may start a new rally and rise to $ 50. Follow Kriptokoin.com for current news about TRUMP.
$BTC $SOL $XRP
#TRUMPCoinMarketCap #SOLVLaunchOnBinance