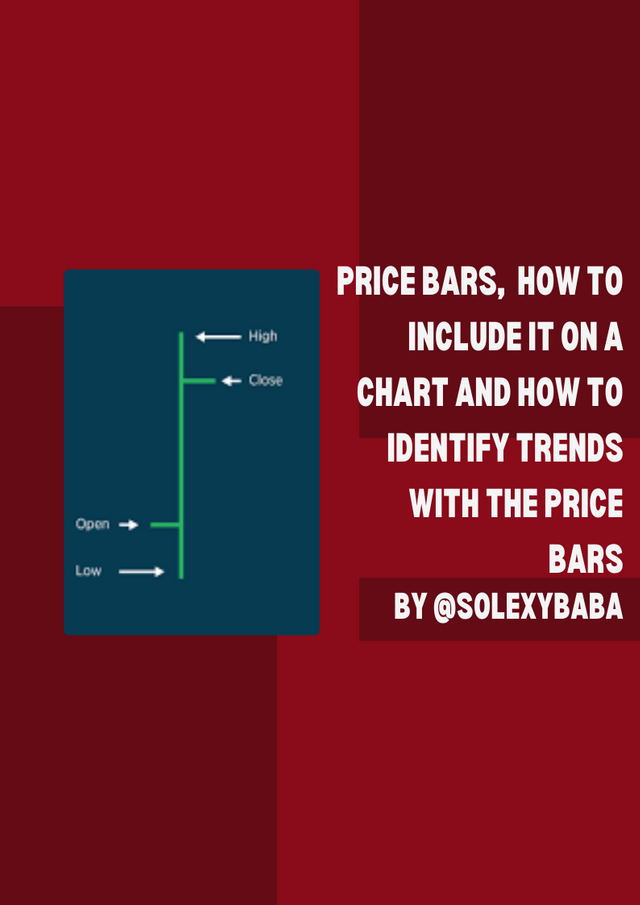
Image edited on Canva
Hello to everyone here in this great community known as the Tron Fan Club I welcome you all to a great week, hope your weekend went well. today I will be talking about an important aspect of the trading chart which I called the price bar. many newbies who are crypto traders may not be familiar with the word price bar, and it is also important to know how to include the price bars on a chart. so today, I will be explaining what price bars mean and also demonstrating the basic steps on how to include the price bars. so relax and I wish you happy reading.

WHAT ARE PRICE BARS?
When we are talking about the digital currency world, there are many methods alongside various tools that show the behavior of the crypto market. the need for these methods and tools is to tell us the activity of the crypto market and the people present in the market at that particular period, this is to make sure of certain processes which are, such as proper entry and exit positions are determined in other not to get to the bad side of our crypto trade in the market. and for this reason, the Price Bar is then included in the Chart. so we will be looking at the Price Bar as we move further.
Just like other tools, the Price bar is also a tool located on the chart. it works to show cryptocurrency traders the action of cryptocurrencies' price regarding the market. so today our main focus is to know how to identify market movement using the price bar, with this we can then get a clear picture of what the market is doing at a given time using this method.
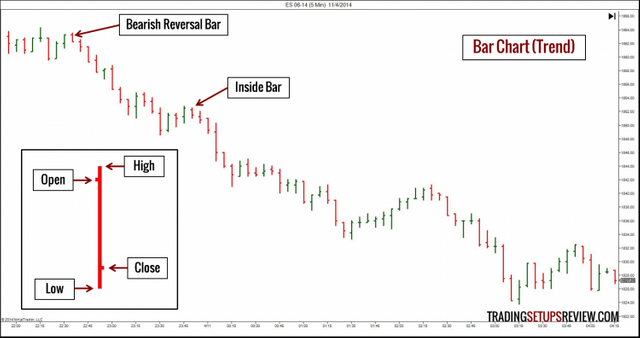
Just like the candlestick, the price bar also demonstrates the trend of the market. it also has several; segments and they are four in number. we will also be talking about them shortly.
Each of these segments possesses its special attribute, although they are all used to detect the happening in the market it is done according to the way they were designed to work in. they help crypto traders to know what is going on in the market. another interesting part of these bars is that they can be merged to have a solid view of what the market is doing, and also to predict what might be the next movement of the market.
The following are the four segments of the price bar.
When we talk about the high point located on the price bar, it depicts the highest price which a crypto token price has reached in that specific period. and the high can be located at the upper point of the vertical price bar line.
Talking about the close point, This is the point at which the price of the crypto token is attaining a low-value point at that specific period. and it is found beneath the high point and it is the small horizontal line that is almost at the end of the vertical line.
When we talk about the open, it signifies the point where the crypto tokens just begin to display a new price value at a specific time, and it is seen beneath the vertical line and the close point.
Now the low point is the least value that a cryptocurrency asset has arrived at a specific point in time. and the low is located beneath the vertical line of the price bar.

HOW TO INCLUDE THE PRICE BARS ON A CHART
After understanding the basic concept of the price bars and also its segments. now it is time to know how to make use of the price bars in an effective way. I will be outlining basic steps that can assist as a guide to help us include the price bar on a chart and they are as follows.
- Step one - The first step is to go to your Tradingview after you have logged in, then select your preferred digital token after that you will notice a chart on your screen, on that chart at the upper spot select the Candles option given and then click.
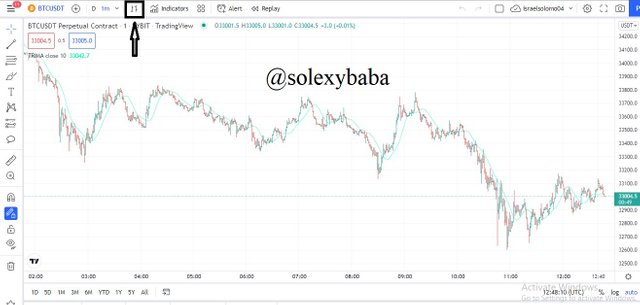
screenshot from Tradingview
- Step two - After the above is done, we then quickly select the Barks option by clicking on it twice in other for it to be displayed on the chart.
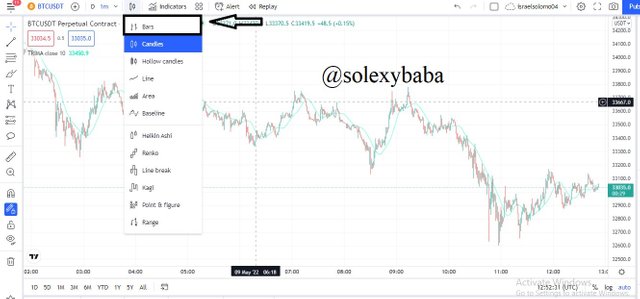
screenshot from Tradingview
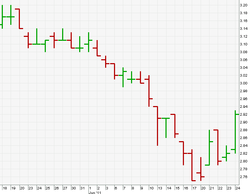
- Step three - After all the above are executed we now rest assured that the price bar has been included on the chart successfully and as seen in the below screenshot the Price Bar is displayed.
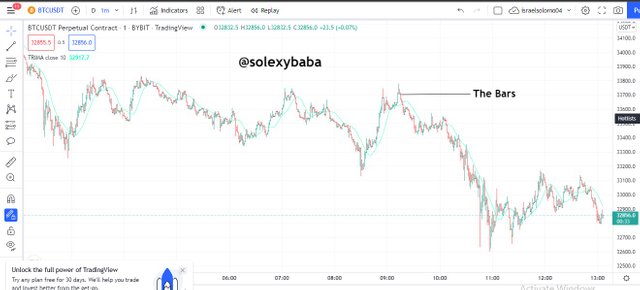
screenshot from Tradingview

HOW TO IDENTIFY TRENDS WITH THE PRICE BARS
With the help of the price bars, it is so simple to identify trends because the state of the price bar is regulated by the individuals in the market which comprises both the individuals selling and the ones buying.
I will be explaining how to use the price bars to identify both trends, which are the uptrend and downtrend.
UPTREND IDENTIFICATION
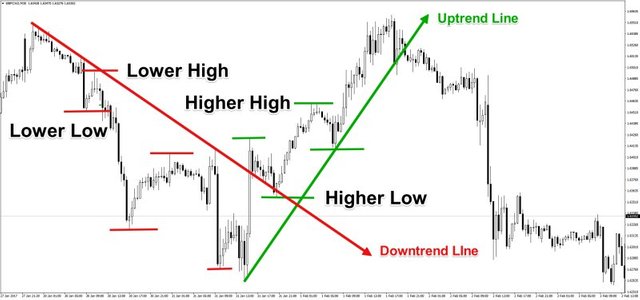
We can sure identify an uptrend movement in a situation where we notice the Price bars representing higher highs in price than lows of assets value in a given market. it is often seen in cases in which in just an interval of one or two days, we can notice the price bars to represent either two or three higher highs in price which is higher than the last highs. in such a situation, we can then say the market is on a bullish trend which thus indicates that buyers taking over the market situation.
DOWNTREND IDENTIFICATION
In identifying a downtrend, is a situation in which the price of an asset is getting lower than the last point, in other identify a downtrend, when the price bars represent lower lows more than highs in asset price, and this is seen mostly within one day or two days, we noticed the price bars to indicate either two or three lows in market price. with such a scenario we can then say that a bearish market trend is ongoing. that is people selling crypto assets are dominating the market.

CONCLUSION
The Price Bar is indeed a great tool that assists users, especially cryptocurrency traders to what is happening in the market, who are the people dominating the market, and also shows us the current condition and behavior of the market. it also depicts the level of assets purchased in the market.
It also possesses four basic parts and these are The High, The Close, The Open, and The Low. they all have their specific attributes. and when they are merged, will showcase a clear view of the market condition. this will also tell us how well an asset is either bought or sold, it also helps in identifying a market trend.
Including the price bar in our chart is very important, all the above mentioned would not have been possible without the price bar, so it is important and recommended to include the price bar to see the behavior of the market before executing our trade. that will be all for today, see you again in my next publication.
Twitter shared
Check out Israel Solomon (@IsraelS49407699): https://twitter.com/IsraelS49407699?t=AT5VTMpn3rnOnKwC_1CnKQ&s=07
Downvoting a post can decrease pending rewards and make it less visible. Common reasons:
Submit
Thank you for sharing and teaching us about this chart.
Hope this is useful for many people.
Downvoting a post can decrease pending rewards and make it less visible. Common reasons:
Submit
Yes the price bars tool has been one of the major tools that has been helping me to know the activity of the market before setting my position. It is a good and useful tool. Thank you for your kind words. Greetings
Downvoting a post can decrease pending rewards and make it less visible. Common reasons:
Submit
This is an educational post. Thanks for sharing
Downvoting a post can decrease pending rewards and make it less visible. Common reasons:
Submit
Thank you so much for your kind words. Greetings
Downvoting a post can decrease pending rewards and make it less visible. Common reasons:
Submit
The activity of the market before setting my position. It is a good and useful tool. Thanks for sharing
Downvoting a post can decrease pending rewards and make it less visible. Common reasons:
Submit
Yes it shows what the market is doing at a given time, and as such kne can make a perfect entry and exist positioning. Thank you for stopping by
Downvoting a post can decrease pending rewards and make it less visible. Common reasons:
Submit
Note: You must enter the tag #fintech among the first 4 tags for your post to be reviewed.
Downvoting a post can decrease pending rewards and make it less visible. Common reasons:
Submit
Thank you so much @nane15 for stopping by
Downvoting a post can decrease pending rewards and make it less visible. Common reasons:
Submit
You have a wonderful discussion with us today about the price bar. This is a must have, for any Affiliate, promoting any program. You have very nicely raised the issue with us
Downvoting a post can decrease pending rewards and make it less visible. Common reasons:
Submit
Thank you so much for your kind words, i look forward to share more quality post in this community.
Downvoting a post can decrease pending rewards and make it less visible. Common reasons:
Submit
This is an informative article. Thank you for contributing.
Downvoting a post can decrease pending rewards and make it less visible. Common reasons:
Submit
Thank you for reading and for your kind words greetings
Downvoting a post can decrease pending rewards and make it less visible. Common reasons:
Submit
Hello friend, @solexybaba
Thank you for publishing this interesting article, I really enjoyed going through it.
I must say, you took time in making such a quality content.
Keep up the good work, and the sky will be your stepping stone
Downvoting a post can decrease pending rewards and make it less visible. Common reasons:
Submit
Thanks for teaching us today .this post was really useful to me
Downvoting a post can decrease pending rewards and make it less visible. Common reasons:
Submit
The pleasure is mine sir. Thanks for reading
Downvoting a post can decrease pending rewards and make it less visible. Common reasons:
Submit
Technical analysis students or enthusiast will find this article useful. Thank you for sharing this lovely tutorial
Downvoting a post can decrease pending rewards and make it less visible. Common reasons:
Submit