Ichimoku Cloud is a powerful tool used to predict breakouts and since I've only been trading for approximately a month, I've developed my own way of using the cloud - and turning it into a landscape; a volcanic one with lakes, lava, and eruptions. I am in no way an expert - and these are just ideas that I've developed for myself for my own learning.
First of all this is what the average Joe is looking at when trading using a platform like bittrex. 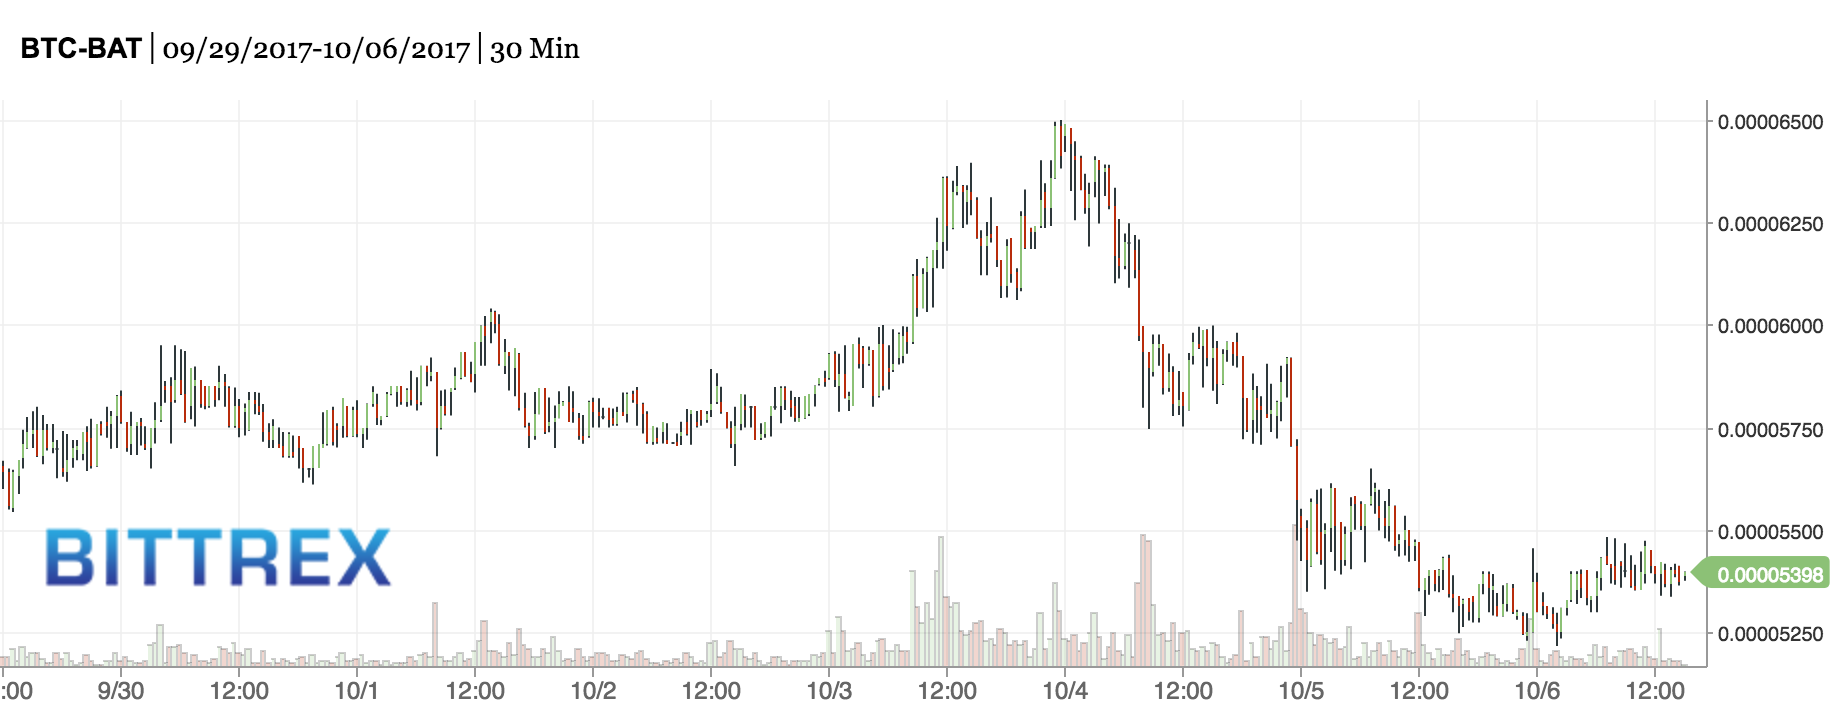
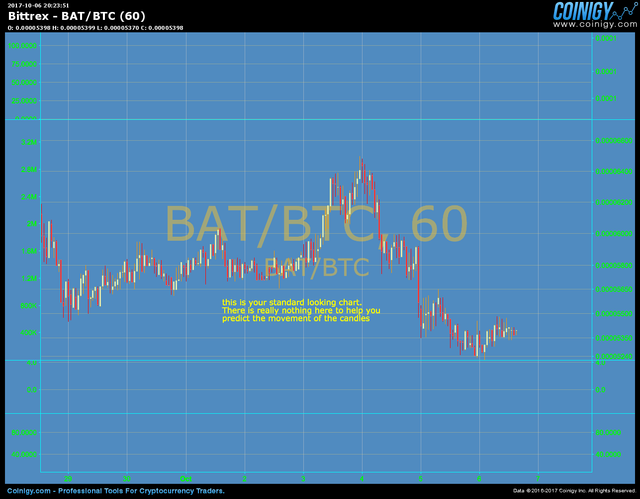
Using a more advanced platform, it's pretty much the same.
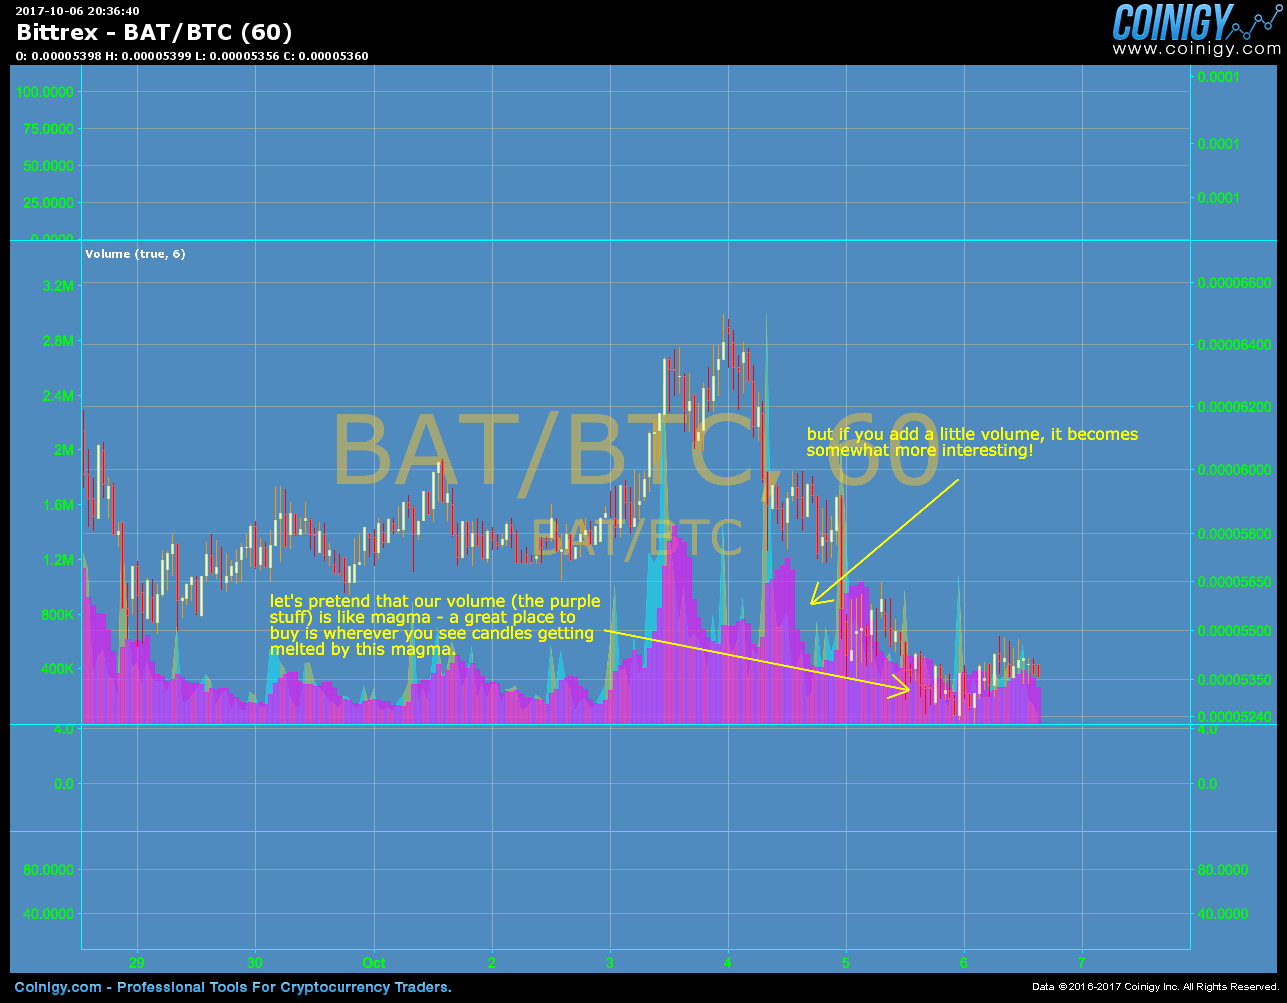
But if we add volume - we can see where it effects the upward movement of the candles.
![bat volume.png]
( )
)
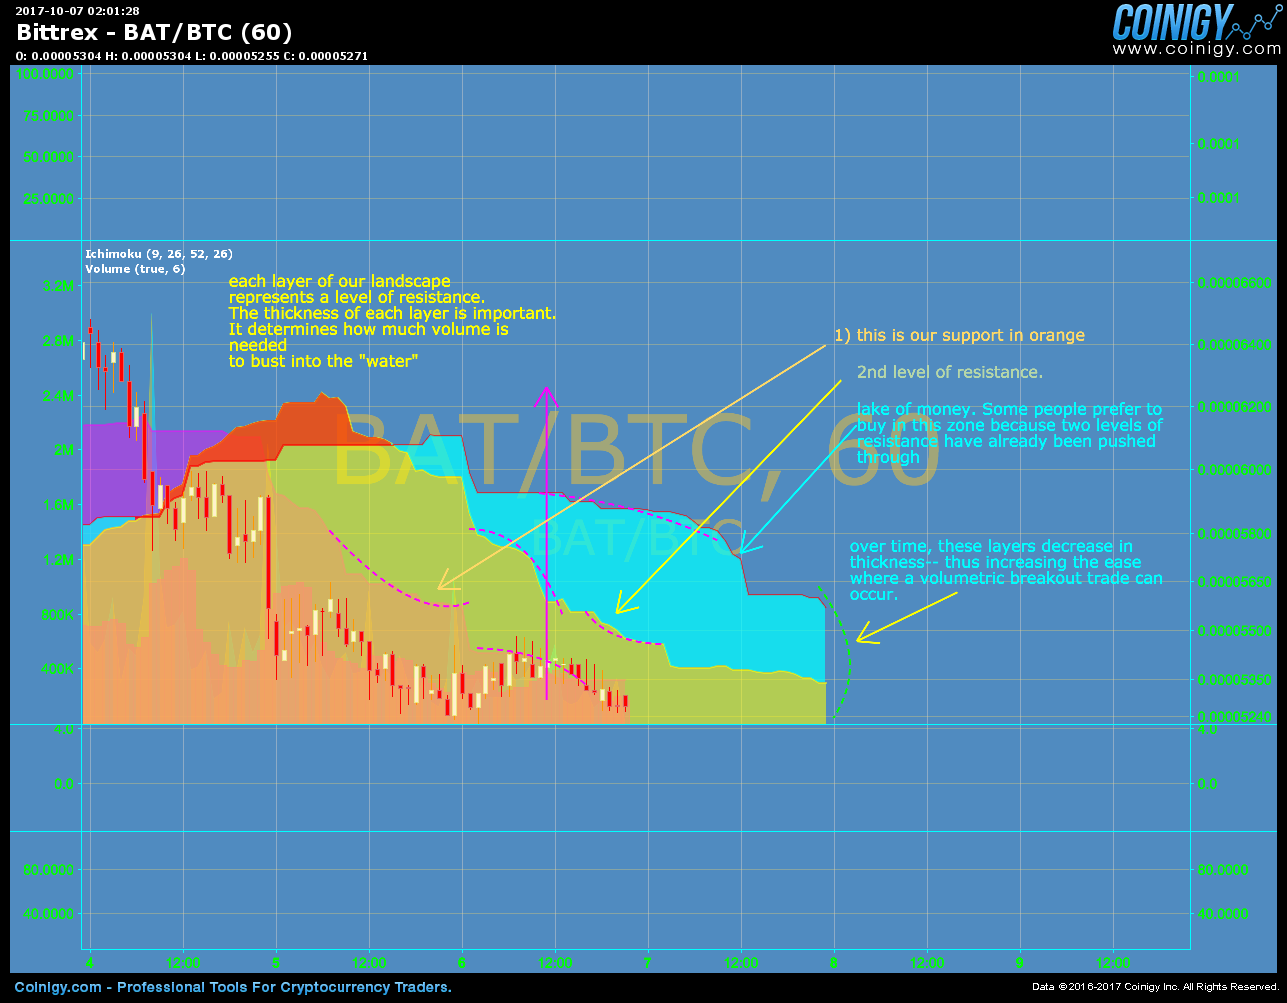
and now we add the Ichimoku cloud. I've color coded the areas of resistance and support. Think of the intense red area as lava. Once your coins sink into the lava - they melt - and you may or may not panic sell.
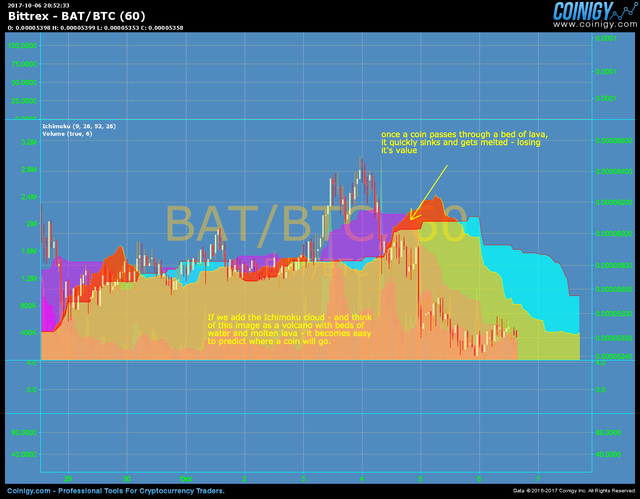
The lighter orange part of our landscape is the support level - or the price that everyone can agree on. Volume is needed (in darker orange) in order to push our coins out of the lake, into the air where you sell for profit. The layers represent levels of resistance - with the lake as key signal - and final level of resistance before the candles bust into sky.
It is important to note the thickness of the layers of color. As time passes - the layers get thinner. A coin that has had zero interest for a long time has a higher probability of a major breakout since price action determines layer thickness.
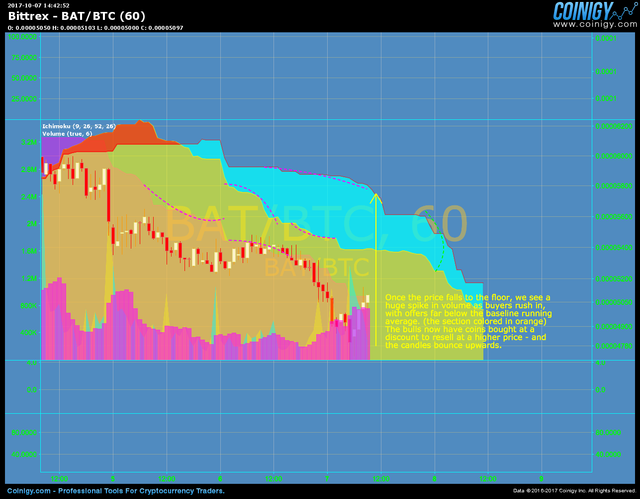
Once a coin drops to the bottom - we see powerful eruptions of volume. I have brought the volume to the front as to visually clarify what is happening
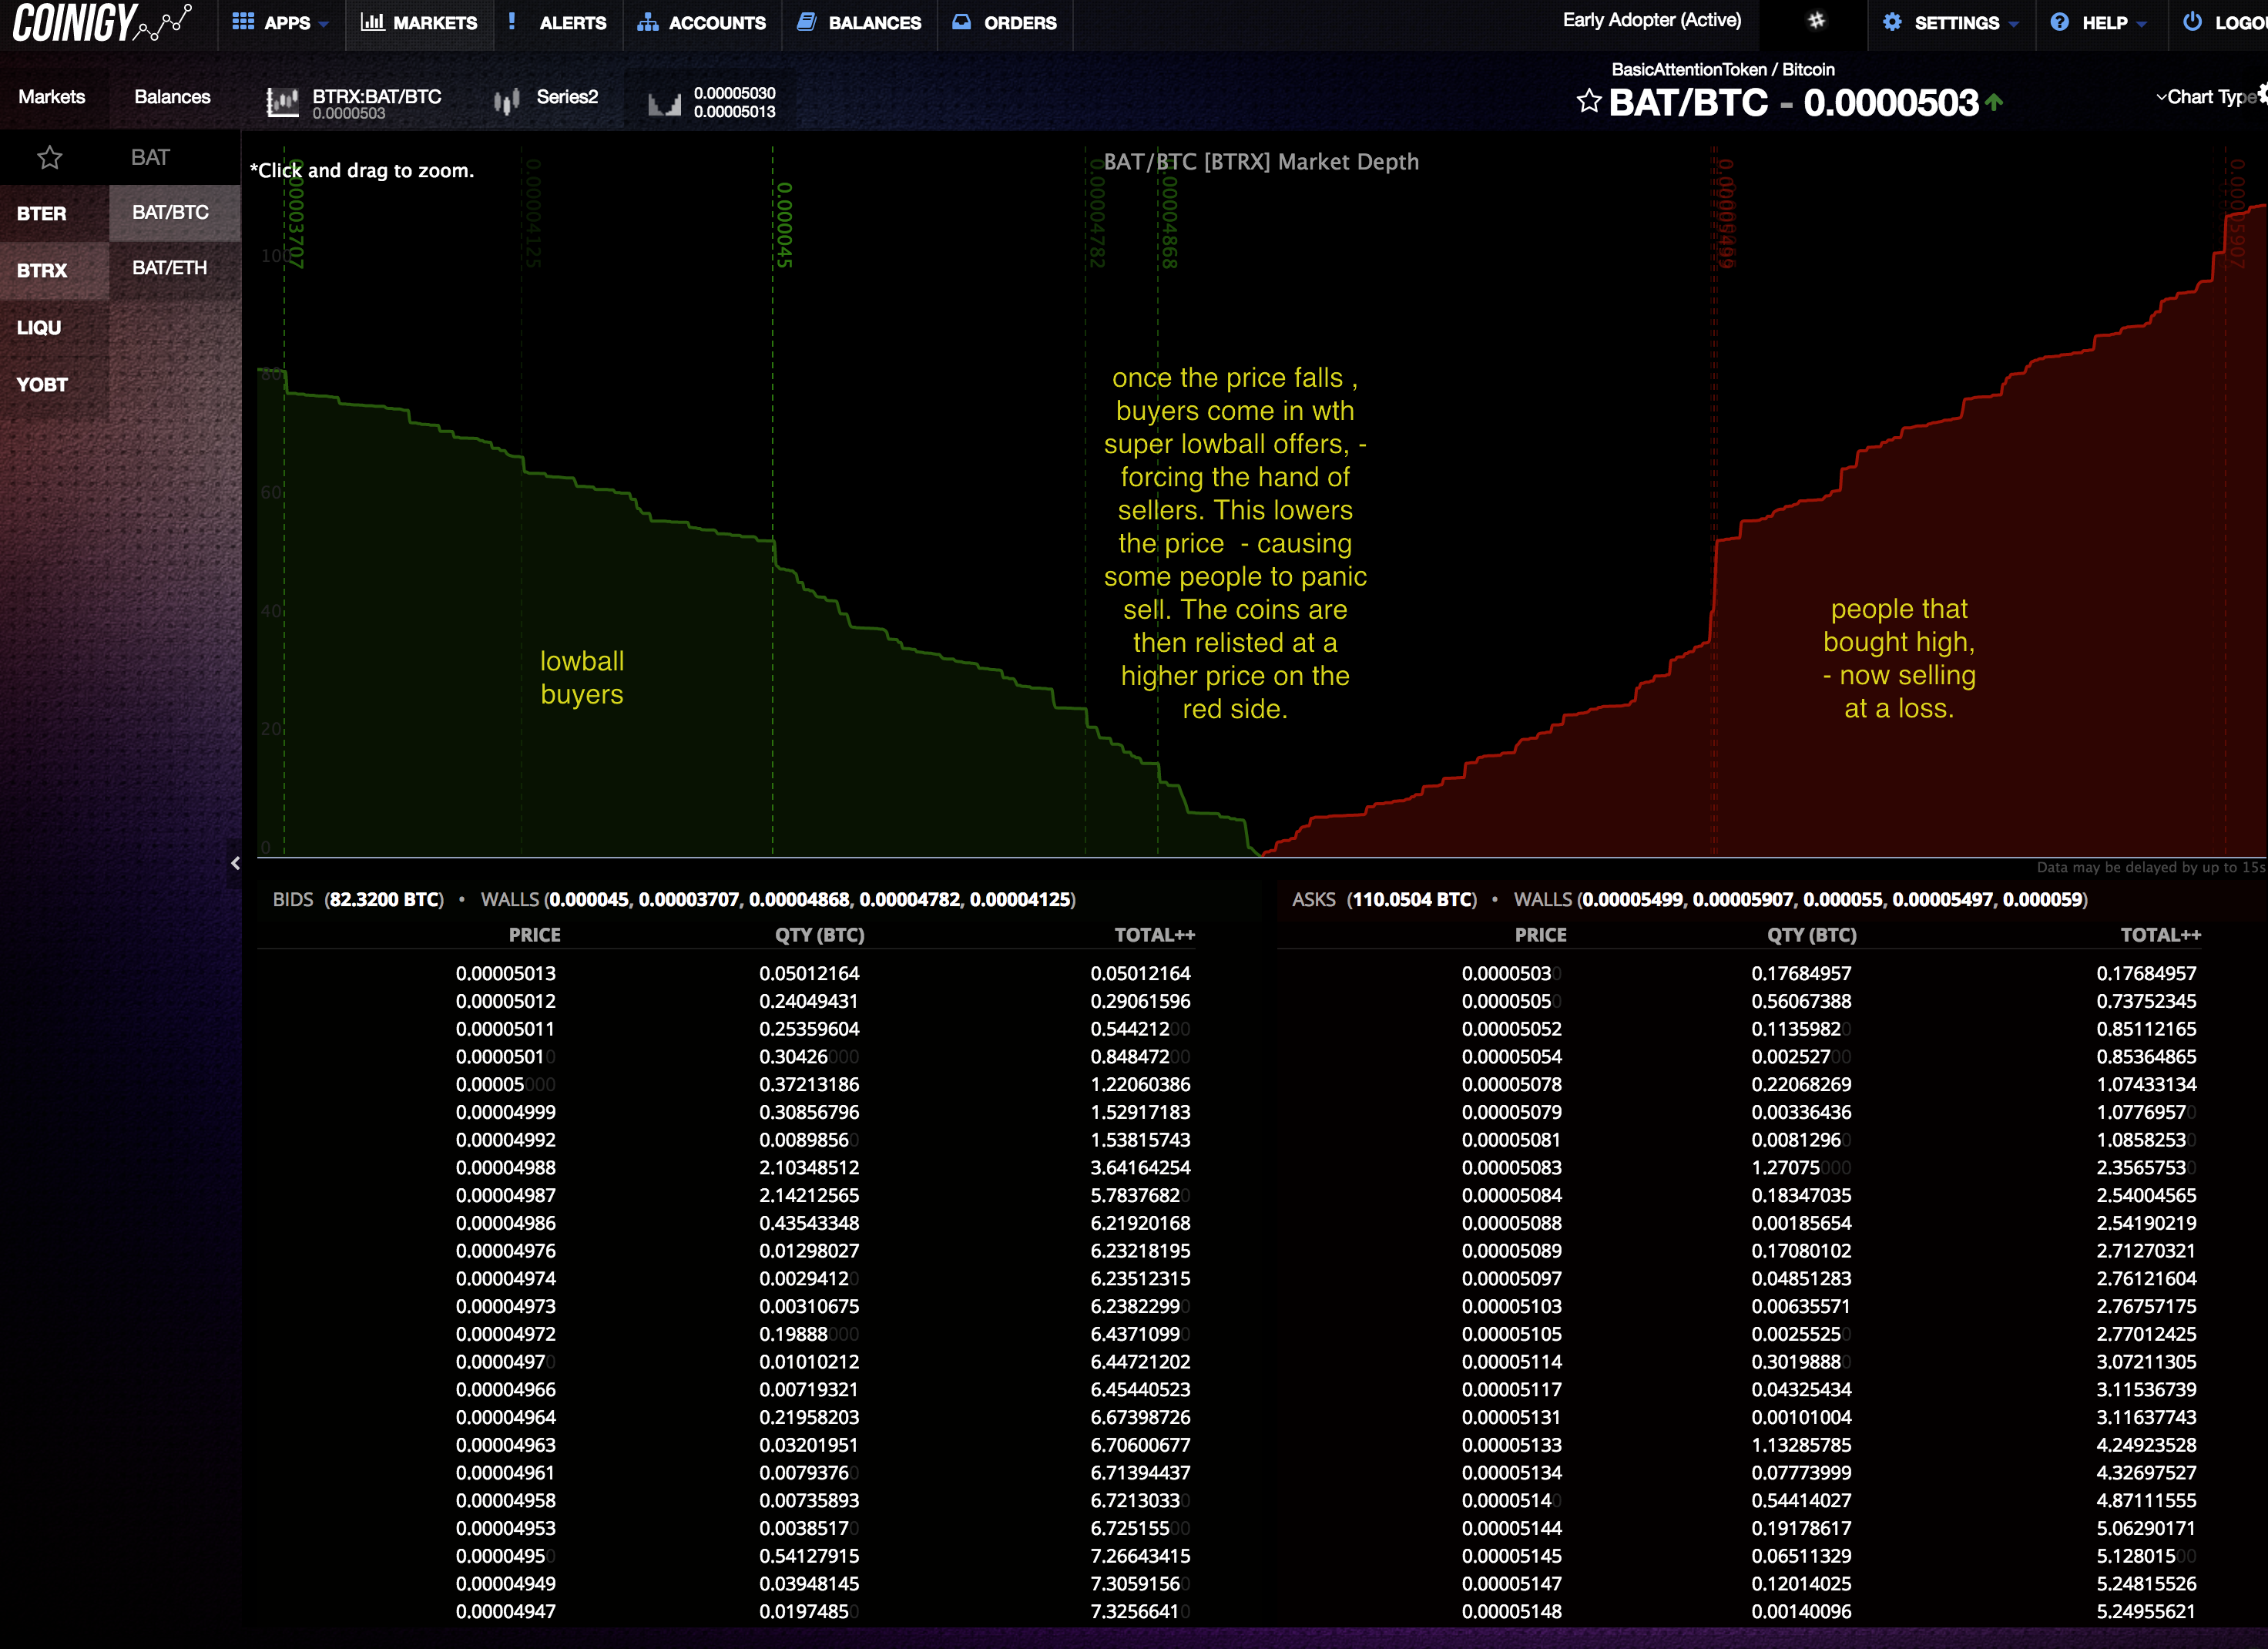
What happens now can be seen in the order book. A surge of buyers come into the scene with ostensibly lowball offers - artificially driving down prices in order to create emotion-based panic selling. The environment for this was created in the breakout before - where the majority of traders bought in at the sight of a "50%" increase.
This is now an even back and forth struggle between bullish and bearing signals. The final result in a bullish trending coin is a massive volcanic eruption - with an increase upwards of 50% in some cases.
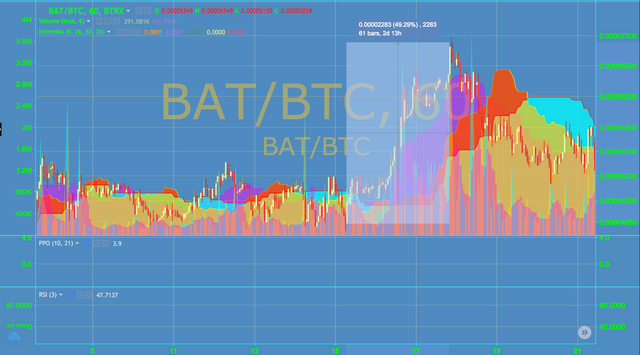
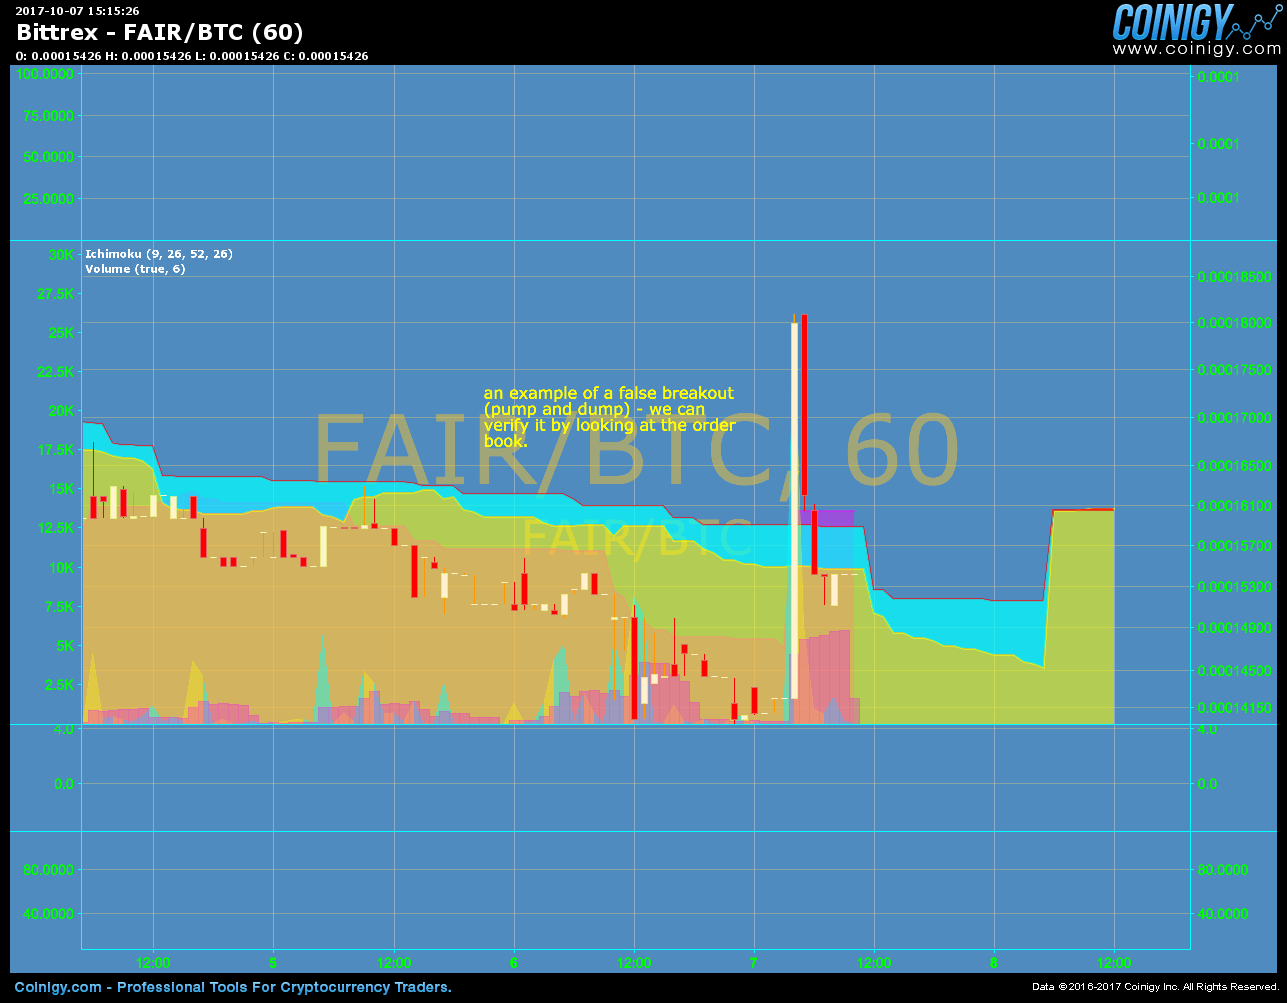
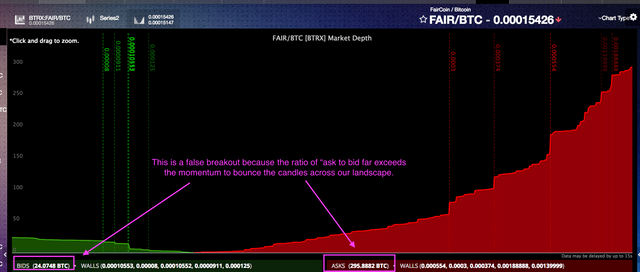
The key ingredient for a major breakout is the ratio of bulls vs bears - with bulls dominating the order book in terms of vested BTC. An example of a false breakout - or a pump and dump; looks like this:
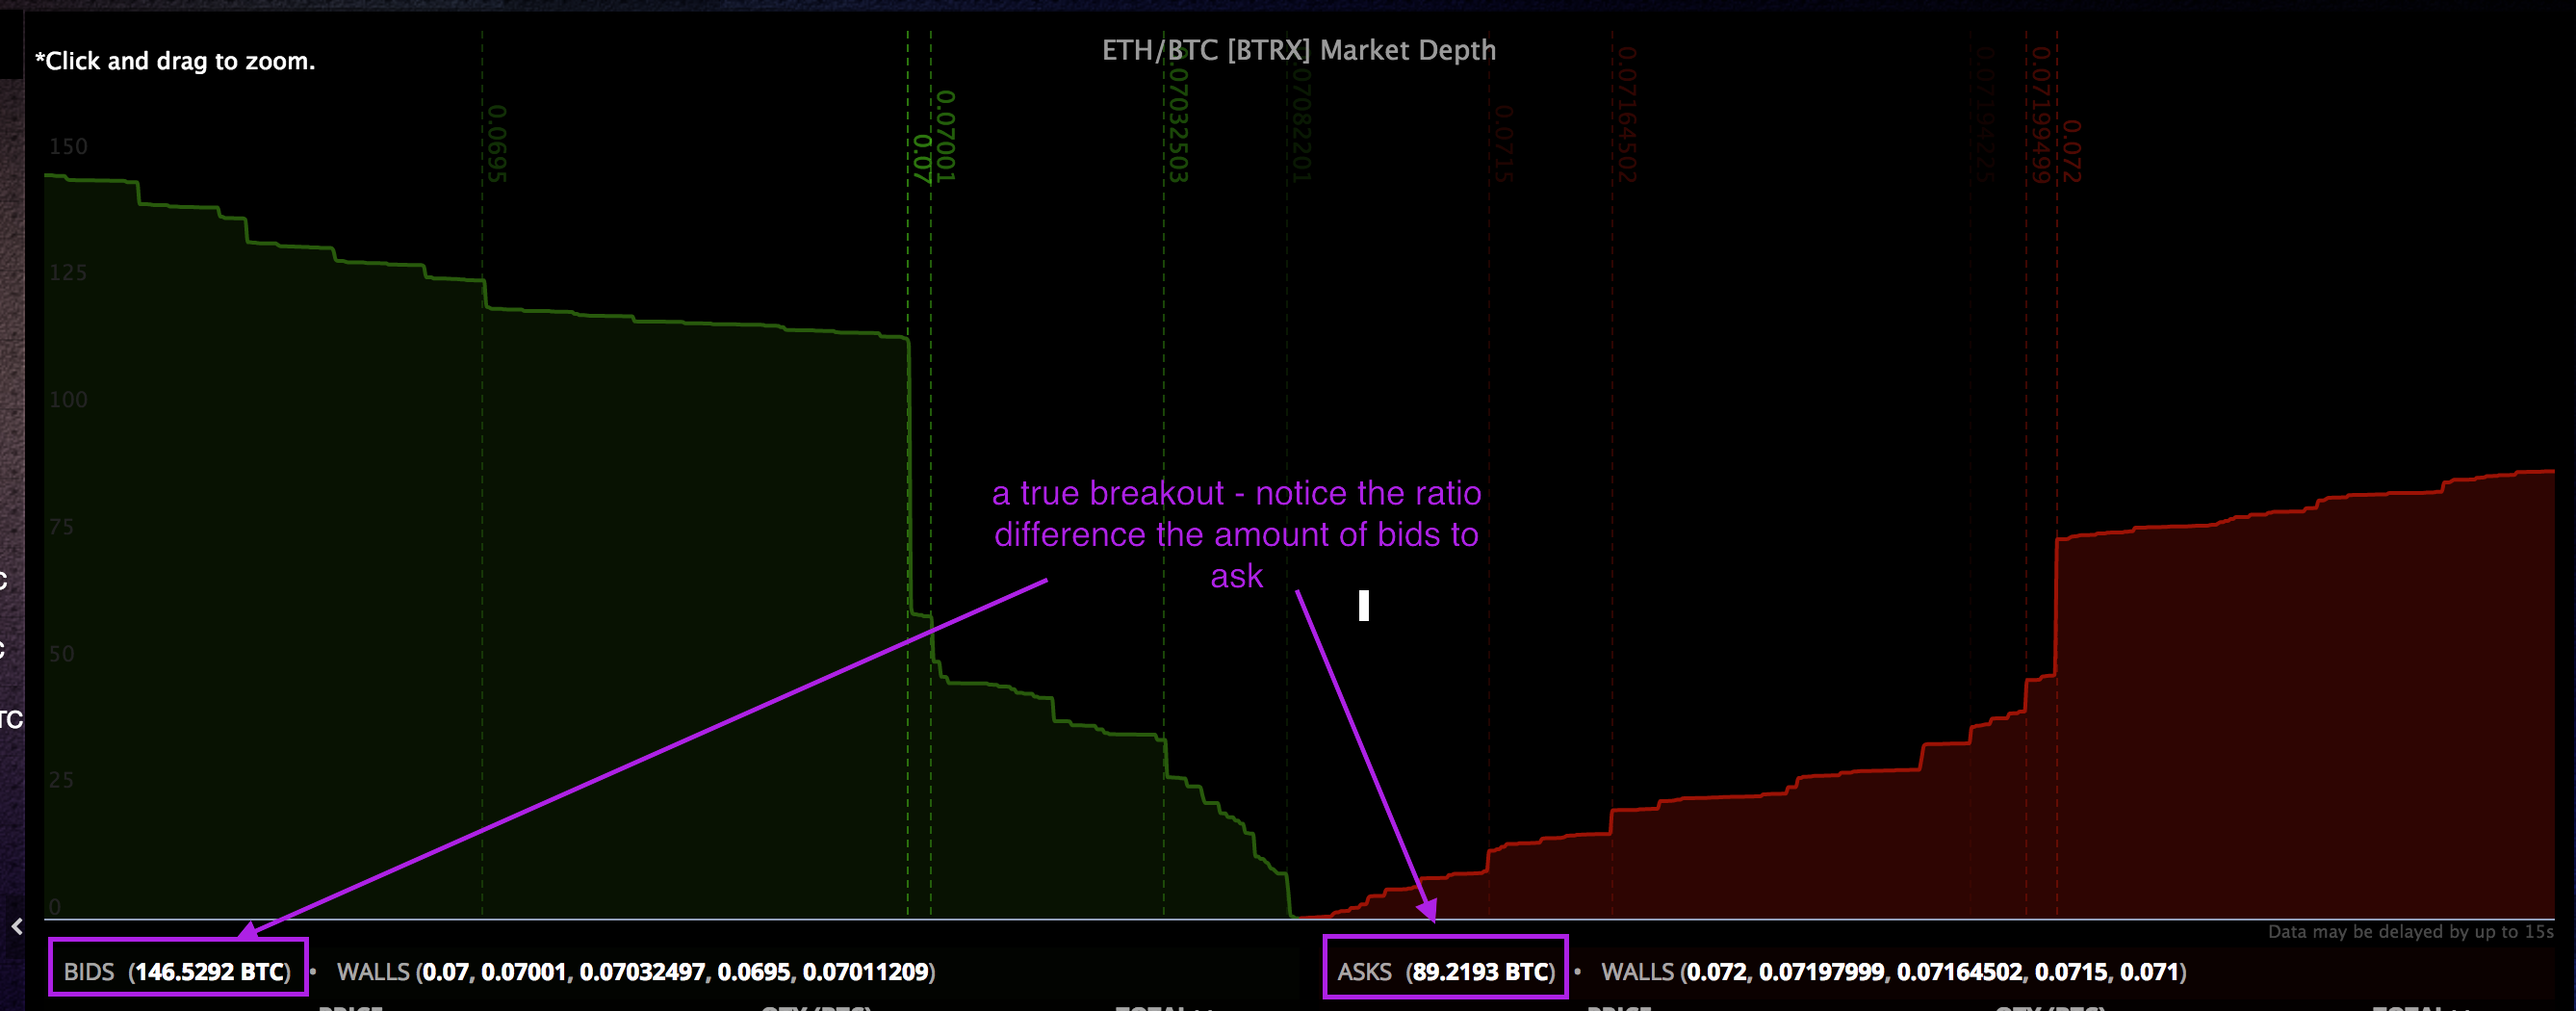
On the other hand, a true and recent breakout occurred with ETH/BTC
As you can see, it falls through the lava and cascades down to the bottom, unable to break through support - where it gets melted and nobody wants it . However, it's tumble in value was slow and meticulous and at the bottom, only a very thin lake was needed for volumetric eruption to throw it into the air.
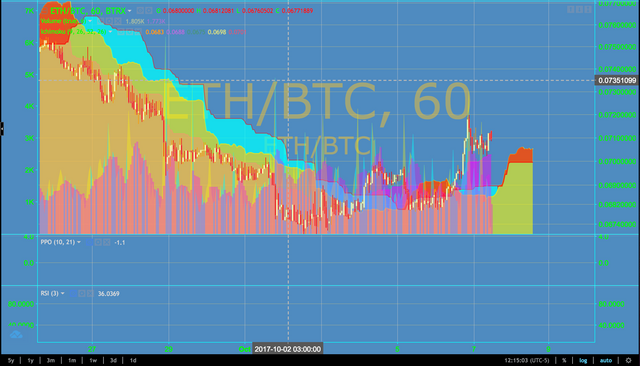
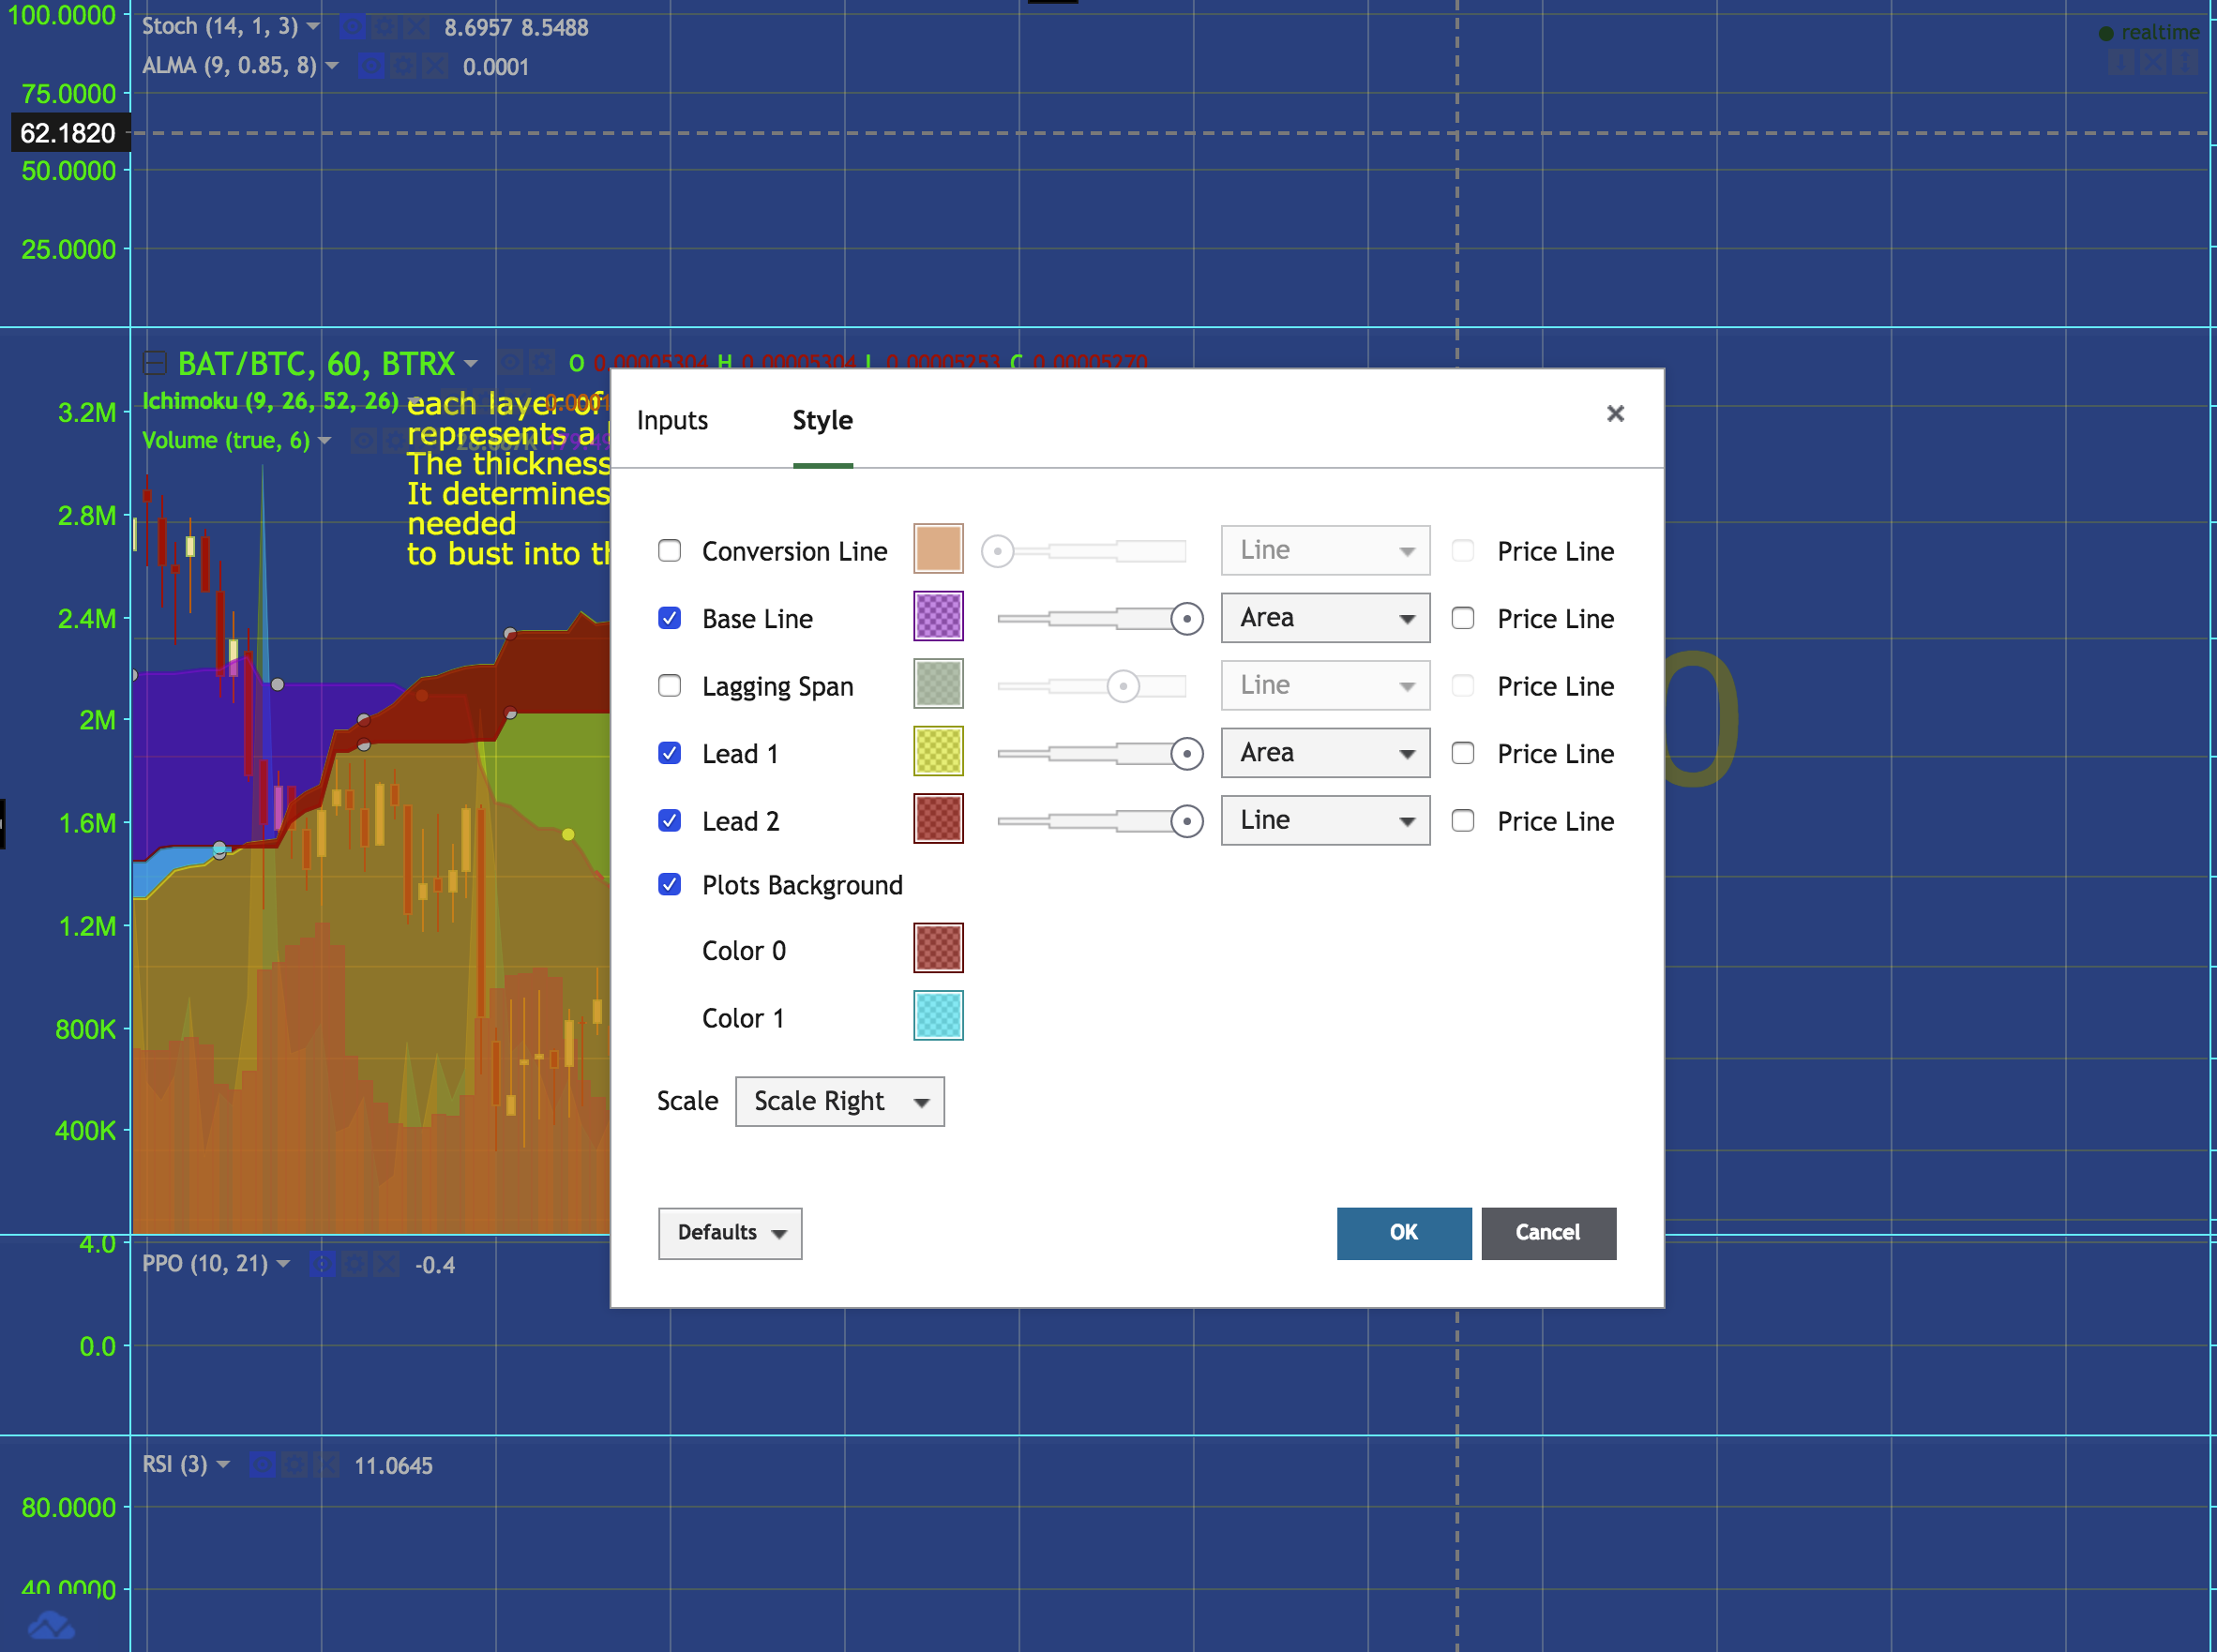
That is all I have for now. I've explained Ichimoku trading this way because I don't know the technical terms used. If you like the settings, here they are:
Congratulations @im-unemployed! You have received a personal award!
Click on the badge to view your Board of Honor.
Do not miss the last post from @steemitboard:
Downvoting a post can decrease pending rewards and make it less visible. Common reasons:
Submit
Congratulations @im-unemployed! You received a personal award!
You can view your badges on your Steem Board and compare to others on the Steem Ranking
Vote for @Steemitboard as a witness to get one more award and increased upvotes!
Downvoting a post can decrease pending rewards and make it less visible. Common reasons:
Submit