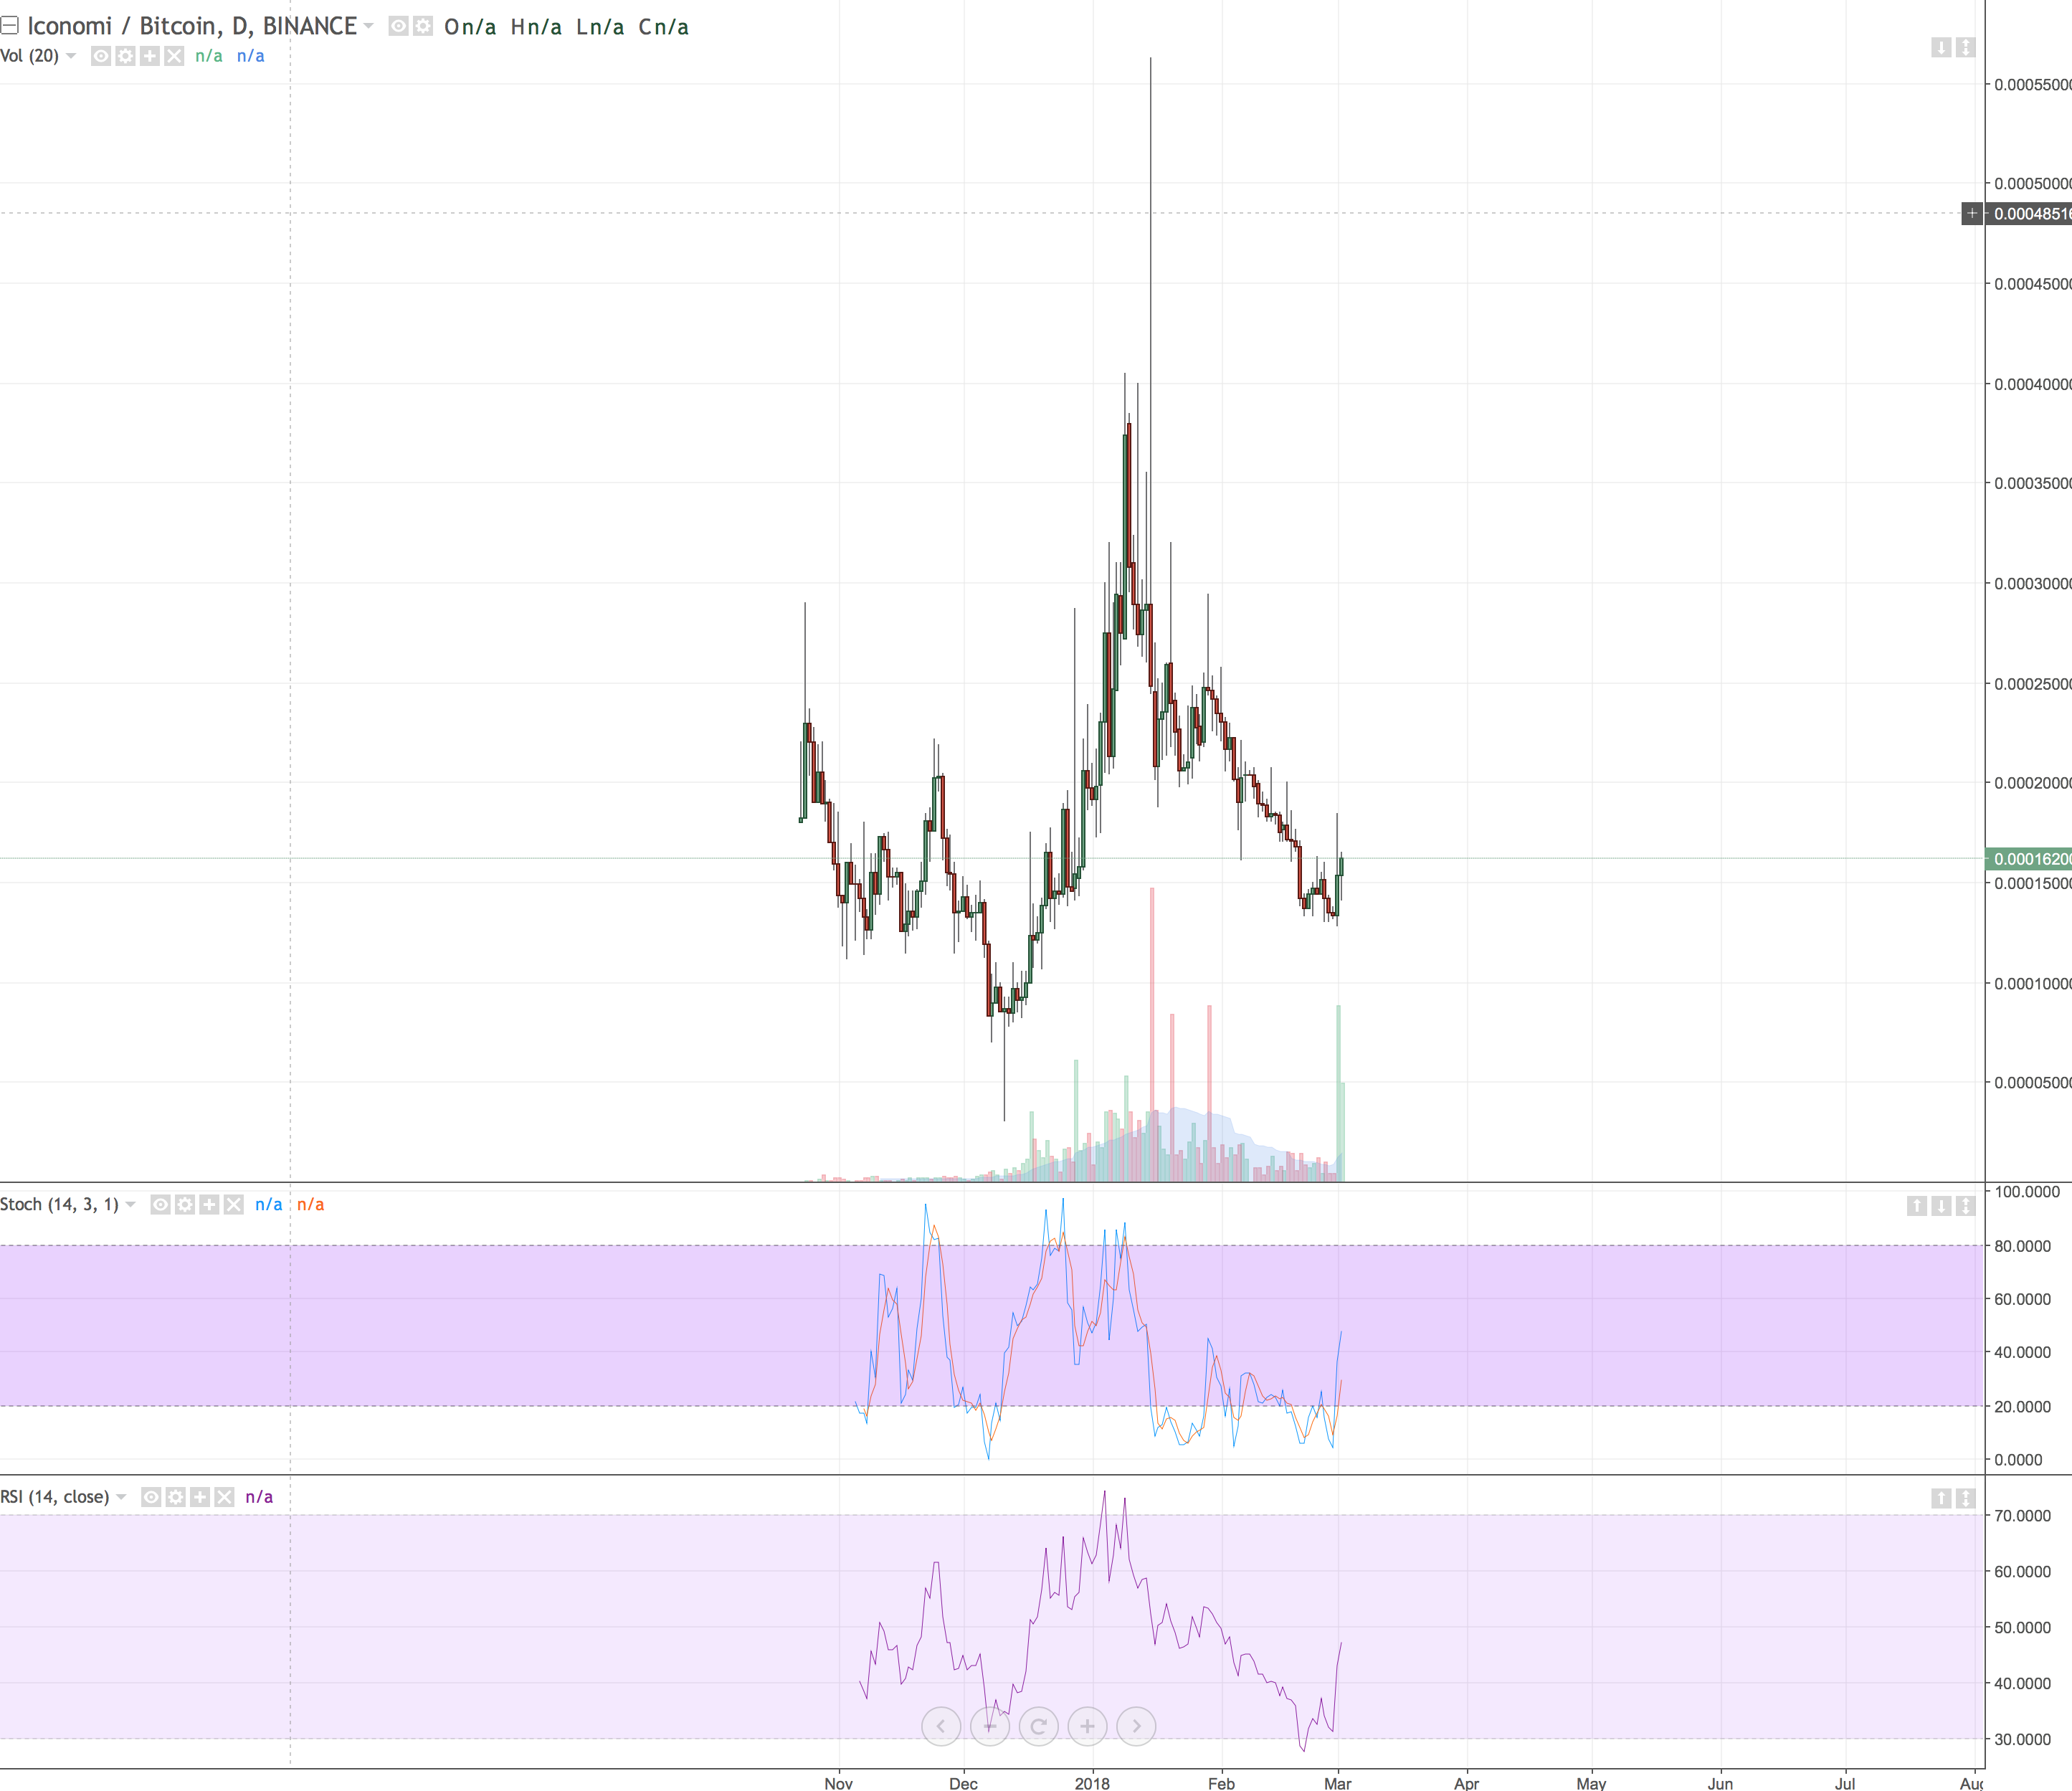
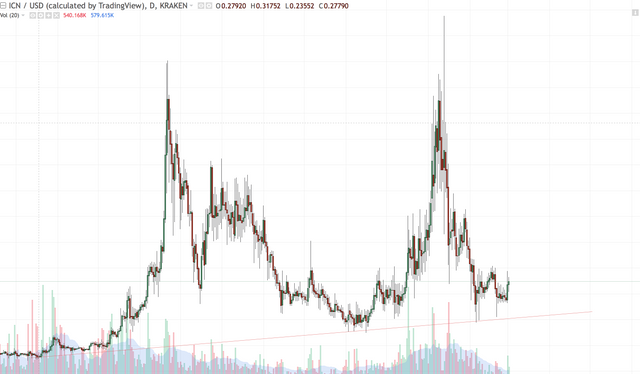
Who knows if it will go down again but for now it's going up in a familiar pattern and is showing a RSI bullish divergence on daily chart


disclaimer
Legal Disclaimer: I am not a financial advisor nor is any content in this article presented as financial advice. The information provided in this blog post and any other posts that I make and any accompanying material is for informational purposes only. It should not be considered financial or investment advice of any kind.
Supper information for us
Downvoting a post can decrease pending rewards and make it less visible. Common reasons:
Submit
I Resteemed your post
Downvoting a post can decrease pending rewards and make it less visible. Common reasons:
Submit
Wonderful information for us
Downvoting a post can decrease pending rewards and make it less visible. Common reasons:
Submit
Downvoting a post can decrease pending rewards and make it less visible. Common reasons:
Submit