Smackdown for Bitcoin. Italy says they will stay in Euro. Trade war is rumbling. Taking profits in emerging markets and oil and oil shipping. Going short on electricity for more than a yield and risk play. Looking for uncorrelated trades in corn.

Portfolio News
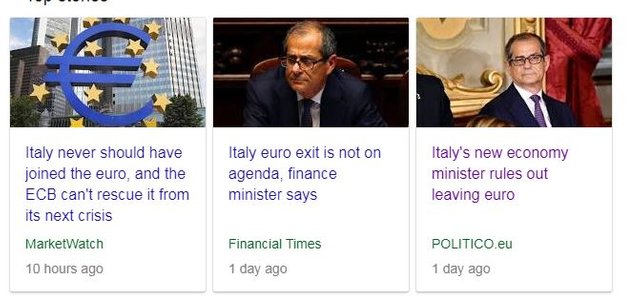
Europe Muddles The European Central Bank meets this week. They will be happy to hear that the new Italian economy minister has ruled out leaving the euro.
That news also cheered the markets with strong moves by banking stocks in Monday trade. My French Banks trade on Friday looks genius - well it will until the statement comes out of the ECB meeting or Italy does something else crazy. The news headlines do carry some hints.
https://www.politico.eu/article/giovanni-tria-euro-italys-economy-minister-rules-out-leaving/
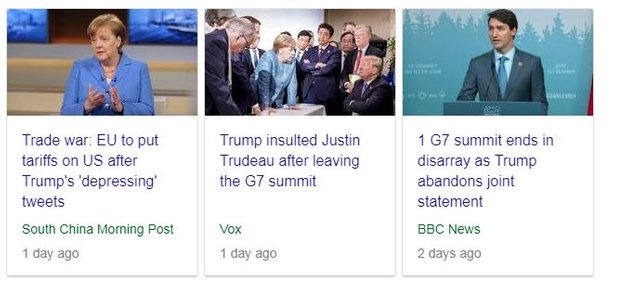
Tariff Tantrum G7 meeting agreed to work to a rules-based tariff system based on fair trading. That was good news for markets until Donald Trump withdrew US support for the communique following a speech by Canadian Prime Minister, Justin Trudeau.
It seems that everything may not have been as agreed as they all thought OR Trump changed his mind in a petulant outburst. This is not the way trade agreements are built. The markets seemed to absorb the risk of a trade war remarkably well - maybe it was priced in or they were more buoyed of the prospects for reaching settlement on North Korea. At the same time as G7 was going on there was a conference of the SCO bloc nations.
What struck me out of that conference was the commitment to keep the Iran nuclear deal going (Iran was an observer at the meeting).
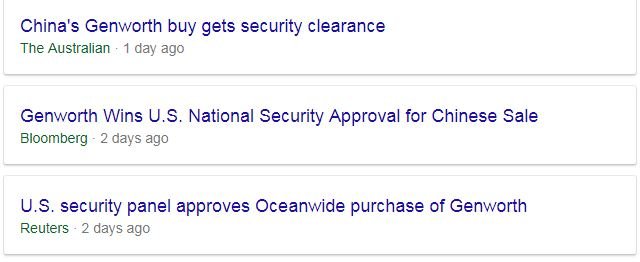
China related news in my portfolio is US regulators approved the purchase of Genworth (GNW) by Chinese insurer, Oceanwide. That made Genworth the strongest performing stock in my portfolios on Monday trade. I would not be surprised to see this as a play in the US-China tariff discussions.
Bought
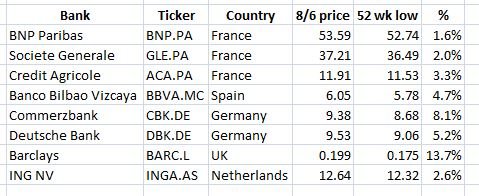
I remain convinced that European interest rates have to rise and banking profits will improve with them. The Italy crisis and soft inflation data has taken the gloss off banking stocks right across Europe. I noticed that French banks seemed to have been affected more than German banks. That surprised me given the extra bad news flowing around Deutsche Bank (DBK.DE). I did a simple review of the top European banking stocks (excluding Italy). I calculated the current price compared to the 52 week low. I was expecting Spain and Germany to be worst. Here is the table.
I am invested in varying ways in all of these banks. Not that long ago (see TIB238), I presented a chart comparing the leaders and the laggards over a longer time frame which showed French Banks ahead compared to German banks. The short term pricing does not fully support that. I increased my exposure to the two worst performing banks to average down my entry price.
BNP Paribas (BNP.PA): French Bank. Dividend yield is 5.6% - 3.6% after withholding tax if you cannot get a tax credit
Société Générale S.A (GLE.PA): French Bank. Dividend yield is 5.9% - 3.8% after withholding tax if you cannot get a tax credit
NYSE Pickens Oil Response ETF (BOON): The open bid on this Oil ETF was hit in Friday trade as oil price softened. In TIB234, I outlined a strategy of using this more diversified oil ETF to reduce stock specific risk of midstream oil partnerships. This trade is part of that to cover the proceeds from the sale of Antero Resources (AR)
ETFS Corn ETC (CORN.L): Corn Futures. I am always looking for trade ideas that are less correlated to other economic conditions. This idea came from a Real Vision video which talked about China and Corn. These were the main points
- China is moving to a market price for corn (i.e., away from subsidies)
- Land available to corn farming is dropping
- China has mandated a 10% use of ethanol for gasoline by 2020. Generally when China mandates it happens
- As wealth grows the consumption of meat increases and specifically there is an important increase in the pig herd in China.
- The inventory of corn in US is currently low compared to use.
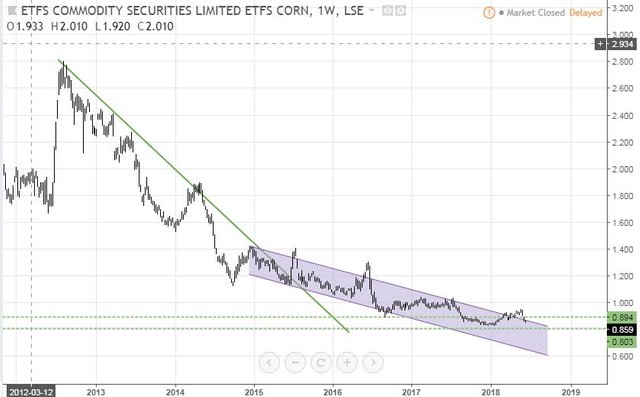
What I like about all these factors is they have little to do with economic conditions in US or interest rates which is what is the basis of most of my portfolio. This trade can be done directly on the futures markets or using Corn ETF's. One of my broking platforms was offering 2018 corn futures - I really want to be further out in time. I did find two Corn ETF's (both in US Dollars), one listed in US (CORN) and one in London (CORN.L). I chose the London one and bought a small parcel. The chart looks ugly and a prudent investor would wait to see a solid reversal before entering the trade.
What I see in the chart is price has progressively been pushed down over several years (2013 highs were lower than prior years). There is a seasonal spike every year which is normally established in June. A strong demand story can change the overall declining dynamic. A solid season could give the normal seasonal spike. I am comfortable being impatient as the drivers for this trade are some time ahead and I can average down my entry point if price does not reverse.
Note: there is some US Dollar risk in this trade. If US Dollar gets really strong, demand for corn from China may not flow into orders for corn from US. Trade tariffs would also hinder this trade.
Sold
Emerging Markets continue to sell off because of the contagion risk of a rising US Dollar. While I feel that the markets will come back to valuing emerging markets based on their economic growth and earnings fundamentals, I am uncomfortable seeing my profits disappear on the way. I reduced my exposure in two key markets by half, Singapore and Malaysia.
iShares MSCI Indonesia ETF (EIDO): Indonesia Index. 3.7% profit since June 2016
iShares MSCI Malaysia ETF (EWM): 2.4% profit since June 2016
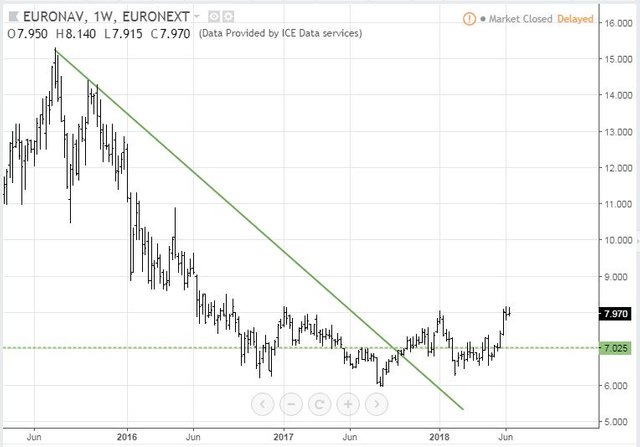
Euronav NV (EURN.BE): Oil Shipping. I bought these shares on a theme that oil shipping would improve as economic growth improves. (See TIB48 and TIB60 for the rationale). That rationale still holds though Iran sanctions does change the dynamics (less oil shipped from the Gulf Area). I ran out of patience and wanted to take some profits - the chart shows that as this would be the time I would consider buying - break up to a new high. 14% blended profit since April/June 2017
Chevron Corporation (CVX): Integrated Global Oil Producer. Chevron price has been holding above $120 for some time which means that my January 2019 strike 115 call option have been in-the-money. I closed them out for 52% profit since December 2016. proceeds will go to the BOON ETF.
Shorts
There are a number of ways to invest in rising interest rates and I am pursuing most of them. This idea came from Real Vision and it attracted me because it had more than an interest rate play. The idea is to sell Electricity Utilities. These are the main premises
- Utility stocks have been a strong part of a yield play while rates on US Treasuries have been low. As treasury yields rise, demand for utility yield will go down as they carry more risk. Utility yields offer 3.4% yield plus (say) 2% capital growth potential vs treasury yields now touching 3%
- Solar power is radically changing the cost profile and availability of energy production ($50 per GW compared to $105 for coal).
- LED growth will radically change energy efficiency reducing the demand for electricity. These two factors will eat away at the capital growth potential for utility stocks
- There are specific problems the industry has to deal with, e.g., nuclear decommissioning, clean energy acts, high debt and rising interest rates.
One trade vehicle is to short an ETF that focuses on Electric Utilities. The challenge with the trade is it has a carrying cost (to borrow the stock and to pay the dividends) which could go on for some time. The second part of the trade idea is to find a yield instrument to fund the carry costs. That yield instrument must be somewhat protected from rising interest rates knocking back price. The idea for this was to use a Municipal Bond fund which pays a comparable yield (it covers the borrowing cots and the dividends) and is somewhat capital protected because Municipal Bonds are tax free to US holders - so it will be the the last thing they sell when yields rise.
In one of my portfolios I did the combination
Utilities Select Sector SPDR ETF (XLU): US Electricity. Short.
BlackRock MuniYield Quality Fund III, Inc (MYI): US Municipal Bond Fund. Long.
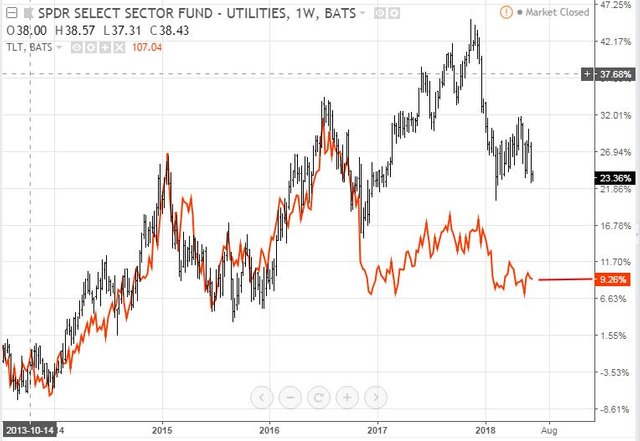
I will put on a chart to show what is expected to happen. The chart compares the utility ETF (XLU - black bars - 3.4% yield) to an ETF for 20 Year Treasuries (TLT - orange line 3.05% yield). Choosing a starting point for a comparison chart is not easy - best done from a low or a high or an event. 2013 was a crossover point where we saw 20 year Treasury yields make a new high.
The chart shows from that point the two prices tracked each other very closely until the 2016 highs (when Treasury yields made their lowest low since the GFC (1.6% - July 2016). This is when the search for yield propelled utility stocks upwards and the charts diverged and the gap between the lines widened. With treasury yields rising we see the gap closing again - I fully expect to see that gap close which is a 14 percentage point move. It works out to a price drop of more than 10% for utility stocks.
ProShares UltraShort Utilities (SDP): US Electricity. There is an ETF that offers an inverse return on utility stocks. The fund manager shorts the stocks and pays the carrying costs and this will be reflected in the way price moves. I added this to one of my portfolios as it is not allowed to short stocks.
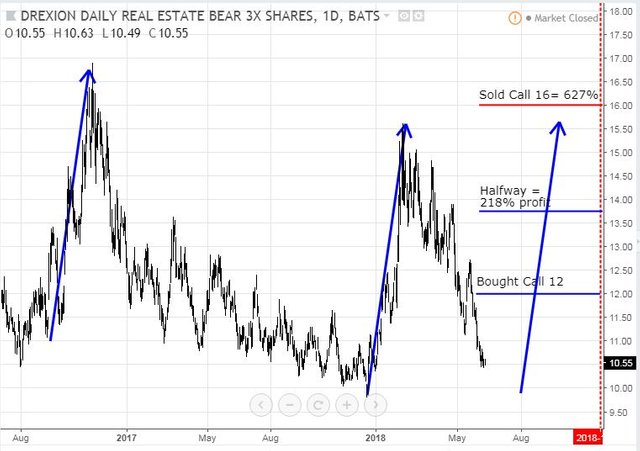
Direxion Daily MSCI Real Est Bear 3X ETF (DRV): US Real Estate Trusts. Last week I added another parcel of the short real estate ETF to one of my portfolios. This allowed me to increase the amount of bull call spreads I am holding. I added another November 2018 12/16 bull call spread. [Means: Bought strike 12 call options and sold strike 16 call options with the same expiry] for a net premium of $0.42 compared to $0.55 first time around for 852% (was 627%) maximum profit if price reaches sold strike ($16) on or before expiry. See TIB239 for the discussion. A quick chart update shows that price is doing what I expected - still going down and it has not yet reached the turning point that I need to win (the bottom of the right hand blue arrow)
Cryptocurency
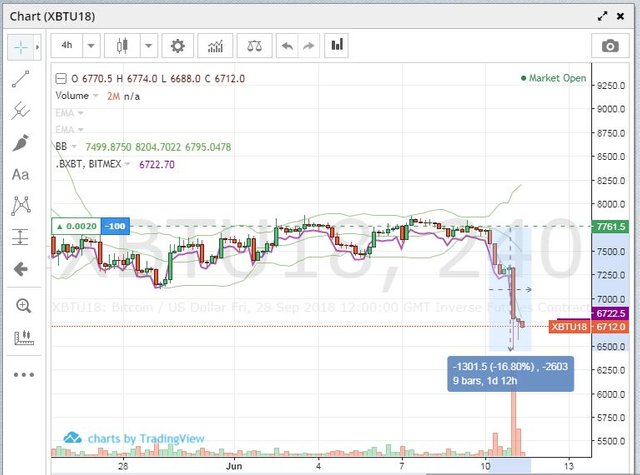
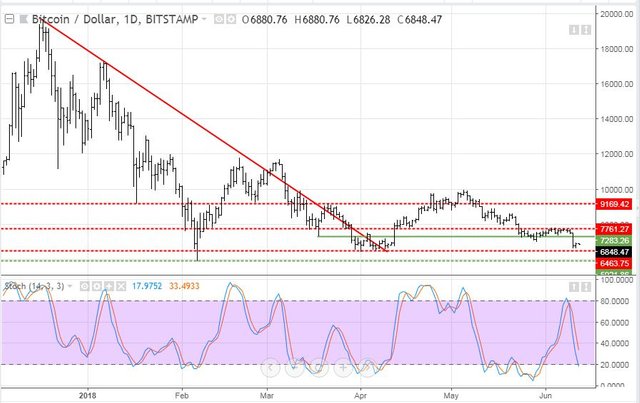
Bitcoin (BTCUSD): Price range for the weekend plus one day was $1059 (13.7% of the high). Price was holding the support level into the weekend and then collapsed. I was not surprised as I had seen two snippets. One was a warning from a friend - what was his source I did not ask.
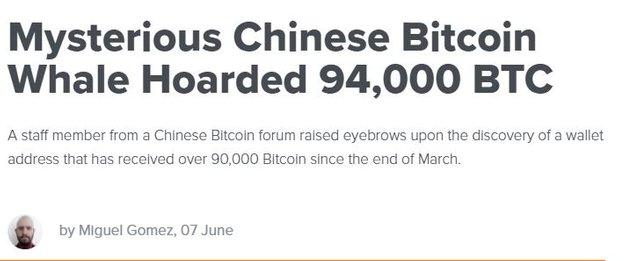
The other was a snippet about a transfer of a large amount of bitcoin to one of the exchanges. I was not really paying attention but this is often a warning of an impending sale.
https://cryptovest.com/news/mysterious-chinese-bitcoin-whale-hoarded-94000-btc/
Markets have been riddled with this process. Dump an asset onto an exchange - chase out all the stop losses and the weak hands and buy back at the bottom. Read this post from @buggedout to understand it - he calls it SMACKDOWN.
https://steemit.com/cryptocurrency/@buggedout/crypto-smackdown-straight-from-the-playbook
A Reddit discussion is enlightening - it tells me more about people who do not understand markets than it does about people who understand cryptocurrency. They make for scared money is my view.
I manage this process in two ways. I do not trade with stop losses in Bitcoin or Ether positions. I do make sure I have enough margin in my accounts so I do not get closed out by the broker. I am also using spread futures to hedge the downside. What does that mean? I buy a short dated future long and I sell a longer dated future short. When the price collapses I buy back the sold future and I wait for a rebound in price before I sell short again. I did this on my Bitmex account last week at $7761 (see TIB241). I bought that back after the smackdown at $6708 for $1053 per contract profit (13.5% leveraged twice)
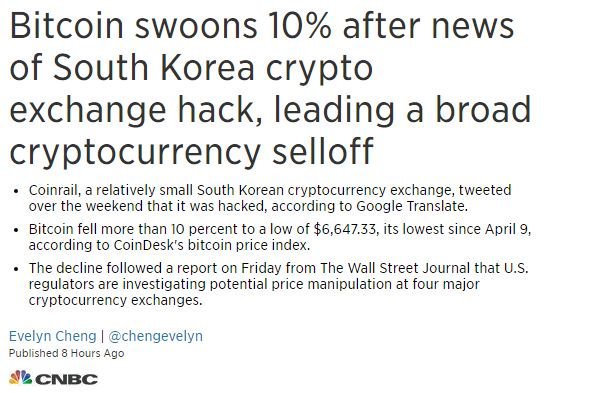
Now there were a number of other factors that could have affected market sentiment. There was a hack on one of the Korean exchanges. The CFTC did subpoena 4 exchanges for data pertaining to market manipulation. Good luck to them as exchanges are spread right across the world and it is easy to move Bitcoin around quickly.
What comes next? Price rejected the support line it had been respecting for a while and has stopped short of the next one down(the lower red dotted line). This is what I expected price to do when it dropped out of "no mans land" a few days ago. We need to see buyers at volume at this level or we will head off to the bottom support line (the green dotted line)
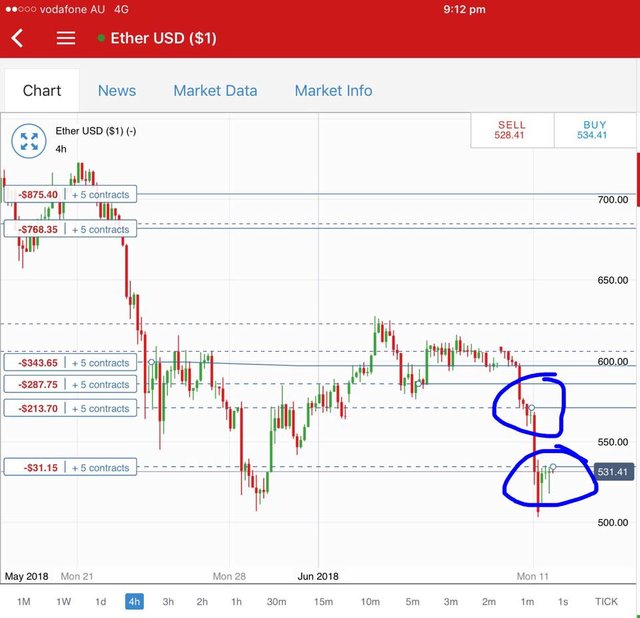
Etherum (ETHUSD): Ethereum did not escape the smackdown. I was looking for reversals over the weekend on a 4 hour chart and placed one trade and was caught in the smackdown. I added another one lower down. I am hopeful that this is the new bottom.
CryptoBots
Outsourced Bot No closed trades on this account (212 closed trades). Problem children was increased with SNT and OMG joining the list (>10% down) - (17 coins) - ETH, ZEC (-43%), DASH (-47%), BTS, ICX, ADA, PPT (-51%), DGD (-44%), GAS (-55%), SNT, STRAT (-42%), NEO (-50%), ETC (-47%), QTUM, BTG (-52%), XMR, OMG.
STRAT joined the -40% club which has a new category of -50% populated by PPT, BTG, GAS and NEO. No surprise after the horror weekend faced by Bitcoin which dragged everything with it.
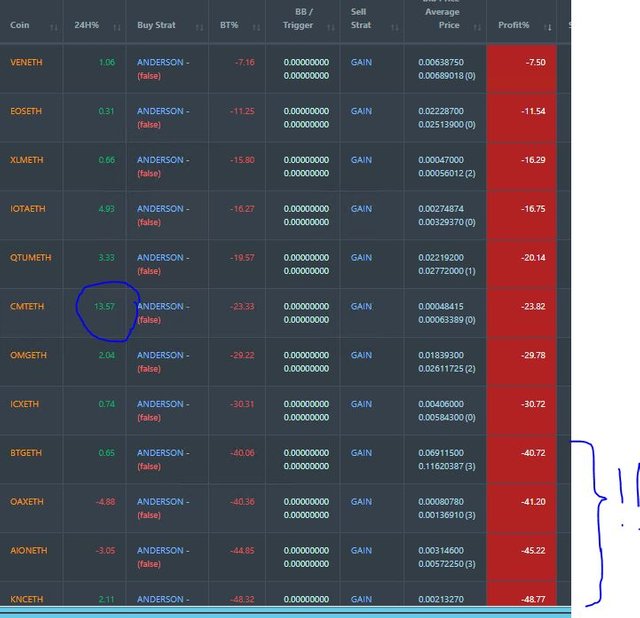
Profit Trailer Bot No closed trades. Dollar Cost Average (DCA) list back to 12 coins with VEN coming back to the list. All 12 coins traded worse with 4 coins now trading at 40% or more down. Quite a few coins did recover in the last 24 hours with CMT making a double digit percentage increase (the green numbers in the 24H% column).
That tells me it is a good time to change the trading model to a whitelist model which may mean biting the bullet on some of these coins.
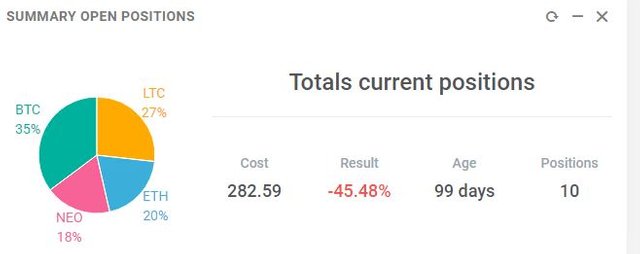
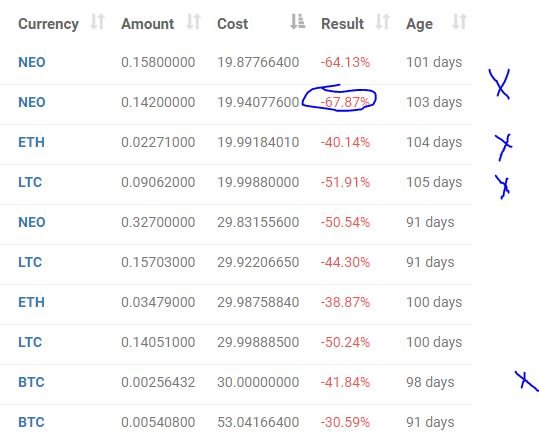
New Trading Bot Positions dropped 8 points to -45.4% (was -37.5%).
All coins traded worse with NEO dropping to -67%. Note: these are priced in USDT (Tether) - probably looks less severe in BTC terms.
Currency Trades
Forex Robot I was right about the VPS being down. The robot wanted to close trades and could not. As soon as I restarted the VPS the robot closed a bunch of trades. Unfortunately I was a day late fixing the problem as the robot closed 88 trades at a net loss of 1.1%. Trading equity was positive but swap cost made it a loss situation. The bot is back and working now and trading at a negative equity level of 0.56% (lower than prior report's 1.1%). There are only 28 trades open - this will grow and negative equity will grow. Lesson learned: pay attention to emails from VPS provider about unpaid invoices - unpaid by broker with no backup payment method from me.
Cautions: This is not financial advice. You need to consider your own financial position and take your own advice before you follow any of my ideas
Images: I own the rights to use and edit the Buy Sell image. News headlines come from Google Search and Cryptoinvest. Bitcoin warning image comes from Facebook.com . All other images are created using my various trading and charting platforms. They are all my own work
Tickers: I monitor my portfolios using Yahoo Finance. The ticker symbols used are Yahoo Finance tickers
Charts: http://mymark.mx/TradingView - this is a free charting package. I have a Pro subscription to get access to real time forex prices
Crypto Trading: get 6 months free trades with Bitmex for leveraged crypto trading including spread futures on Bitcoin. http://mymark.mx/Bitmex
Bitcoin: Get started with mining Bitcoin for as little as $25 http://mymark.mx/Galaxy
June 9-11, 2018


Edits: Added in dividend yields for two French banks - they are worth noting.
Downvoting a post can decrease pending rewards and make it less visible. Common reasons:
Submit
Upvoted ($0.17) and resteemed by @investorsclub
Join the Investors Club if you are interested in investing.
Downvoting a post can decrease pending rewards and make it less visible. Common reasons:
Submit
stellar review - time to rethink my own strategy
Downvoting a post can decrease pending rewards and make it less visible. Common reasons:
Submit
Thanks. Be clear to keep strategy and tactics apart. A lot of what I am doing is tactics as part of some big themes:
Downvoting a post can decrease pending rewards and make it less visible. Common reasons:
Submit
I like the corn trade long term...thanks.
Downvoting a post can decrease pending rewards and make it less visible. Common reasons:
Submit
A very interesting program about TIB: Today I Bought (and Sold) - An Investors Journal # 245 - Indonesia. Malaysia, French Banks, Electricity, Oil, Oil Shipping, US Real Estate,
I am Indonesian I am very proud of you @carrinm
Downvoting a post can decrease pending rewards and make it less visible. Common reasons:
Submit
no other words for you @carrinm, always successful and keep the spirit
Downvoting a post can decrease pending rewards and make it less visible. Common reasons:
Submit
A remarkable program @carrinm, great work hopefully no obstacles and continued success @carrinm.
Downvoting a post can decrease pending rewards and make it less visible. Common reasons:
Submit
Hey @carrinm, thanks for the analysis and giving us a peak into your portfolio and trades. We have something in the works that might help you get yourself more exposure and monetize your analysis. Learn more about us here:
Introduction and
Leverage TIMM for
profit, and let me know if
you’d like to get a free trial. You can also chat with us:
Discord
Cheers, Jimmy
Downvoting a post can decrease pending rewards and make it less visible. Common reasons:
Submit
A little bot work yesterday on this post. Before and after posts show I gathered a lot of votes but not enough voting power to warrant the 2 SBD invested. Not far off though. The telling part is whether I gathered any new followers - I did not check that
Downvoting a post can decrease pending rewards and make it less visible. Common reasons:
Submit