Markets did get ugly from the tariffs. I am looking further ahead in time on technology and offshore oil. I also take my lumps on the short side of a long:short trade and get hit on a trade I failed to cancel from the day before - more chemicals and more time.

Portfolio News
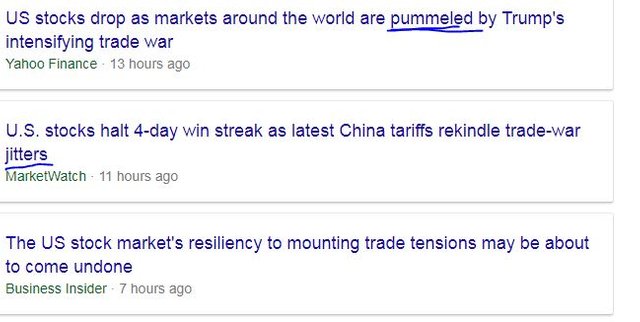
Market Jitters - Tariff Tantrum As expected global markets took a pounding overnight on the "reckless" Trump tariffs.
Nothing was spared apart from utilities. It is always interesting to read different emotions in headlines. For some people it was a pummeling and for some it was jitters. My portfolios went down 1% - that feels like jitters to me. That said, I do have a lot of short positions which makes a pummeling feel like jitters. A line from this article may explain the difference between jitters and a pummeling. While China only takes in $105 billion of US exports, American companies do account for $350 billion of sales in and from China. Tariff that and the battle is not as unequal as Donald Trump thinks.
Research from Capital Economics (CE) shows sales from US-owned affiliates total $US350 billion – similar in size to the US trade deficit
https://www.businessinsider.com.au/trade-war-china-target-us-multinational-companies-2018-7
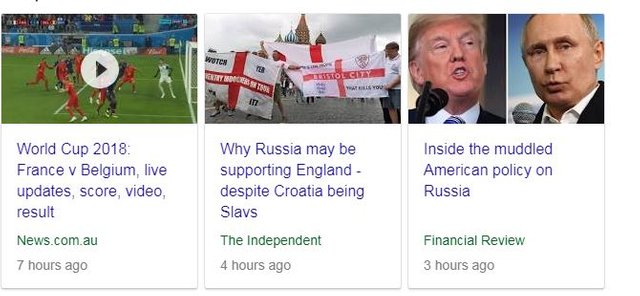
World Cup Russia headlines from Google begin to focus in on the NATO and Putin summits.
Donald Trump takes a big swing at Germany, with whom he says the US has a special relationship. It would be more special if Germany spent more on defense buying US-made arms and bought less gas from Russia. I really do wonder what he and Vladimir Putin will talk about on July 16.
On the football fields, Croatia continued its dream run and England went home after a great tournament. Home to face a country led by an increasingly divided Brexit government.
The headlines focus in on dodgy linesmen and dodgy socks rather than an amazing tournament for both teams.
Bought
Globalive Technology Inc (LIVE.V): Artificial Intelligence. Emerging technologies has been a weak point in my investing. I have done OK on mainstream stuff. I have had my eye half open for opportunities in neural networks and artificial intelligence. I would really like to find an ETF that does focus on these ideas. I did see this Canadian technology business pop up in a Steemit post from @crushthestreet. They invest in a range of ventures in blockchain and in AI - the listing is relatively new. I took a punt of $1,000 Canadian in two of my portfolios - it is a punt. I will be looking for a few more as I never know which one will win.
https://www.globalivetech.com/
On the @crushthestreet post, I do not endorse what I see as a post spruiking an idea without demonstrating any due dilligence - add some value is all I can say rather than just cutting and pasting material from elsewhere.
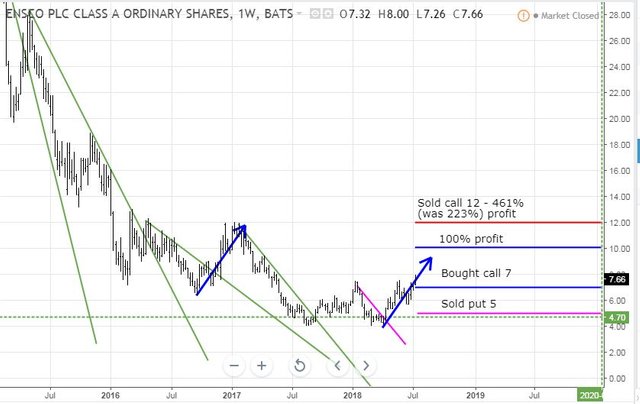
Ensco plc (ESV): Offshore Oil Driller. I wrote yesterday in TIB262 about the idea of increasing the profit potential of the 2020 bull call spread I bought. The idea is to sell a put option that is well out-the-money to grab more premium to reduce the premium in the trade. The key is one has to be totally comfortable holding the stock if price falls as far as the sold put strike.
In this case, Ensco share price is trading at $7.66 and I sold a strike 5 put option. That level is just above the all time lows for the stock. If the oil price holds at current levels and Ensco stay solvent, I would be totally comfortable buying its stock at $5 in January 2020. Now there is a risk that the option could be exercised early if the price absolutely tanked and I would be saddled with a dog.
What this trade does is increase the profit potential from 223% TO 461%. Of note on a day when many energy stocks dropped 4 to 5%, Ensco dropped 3%. I must say I was surprised to get a bid accepted at the overnight last trade price.
BASF SE (BAS.DE): Chemicals. When I set up the 84 call strike options, I put in bids for 2021 expiries and added the 2020 expiries when I saw there was little liquidity in 2021. I did not take the 2021 trade off - that trade got hit overnight. That gives me more time to be right but at double the exposure. Premium was €7.50 (8.9% of strike) which is only just a little more than I paid the day before for one year more to expiry.
Shorts
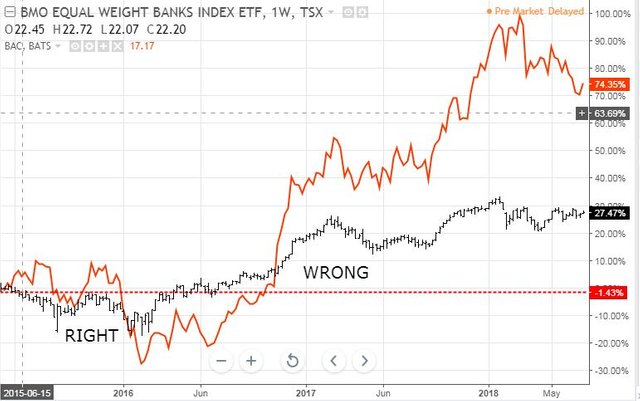
BMO S&P/TSX Equal Weight Banks ETF (ZEB.TO): Canadian Banks. This short trade was part of a long:short trade with US Banks, specifically Bank of America (BAC). The idea of a long:short trade is to take a long position in a stock one expects to rise and take a short position in a stock one expects to fall. Ideally one should look for stocks that are somewhat uncorrelated with each other. Best case is both stocks do what you expect. Worst case is both stocks do the opposite. Middle case is one does the right thing and one does the wrong thing and it does not matter which way around it is. The higher the lack of correlation the higher the chances of both legs working improves.
The idea which came from my investing coach in June 2015 when this trade was opened was that the US economy would continue growing and the Canadian Economy would shrink on the back of sliding commodity and oil prices. What time has shown is that the stocks are quite well correlated with each other especially once the commodity price slide ended. The short trade was profitable until May 2016 and the long trade on BAC did ultimately overtake the short trade and provide a net positive outcome.
I saw the headline that the Bank of Canada was raising interest rates. This is good for bank profits. I took action to close my short trade before the price spiked back to the highs it has been at.
The short side provided a 29% loss on the capital value plus 3.19% dividend yield paid away (three years worth) plus stock borrowing costs. Did the long:short win? BAC went up in that time 64% and the Canadian Dollar depreciated by 5.9%, BAC dividend yield was 1.6% - giving a net yield loss of 1.6% annually (times 3). Add that all up - 64% minus 5.9% minus 29% minus 4.8% (DY times 3) minus 15.3% (borrowing cost times 3 years) = 9% net profit spread over 3 years. I would have been better off buying the Canadian banks stock and lending them to a stock borrower and banking the capital gain as a bonus.
I am noticing in one of my portfolios that stock lending fees are growing dramatically on stocks I am lending out. This is also telling me a lot about the state of markets - more fear means more short selling means more stock borrowing fees available.
This trade is a solid learning example about exit strategy. It is also a solid learning example about correlations. These trades were more correlated than my coach imagined. There was an exit point when the fundamentals changed - all one has to do is plot the oil price or the copper price to identify when the dynamics of the Canadian economy changed. I did not do that. There is also a timeline for running any short trade as one needs some form of compensating income to cover income paid away plus financing and stock borrowing cots. If the trade does not work inside a short period, cut the short leg.
Cryptocurency
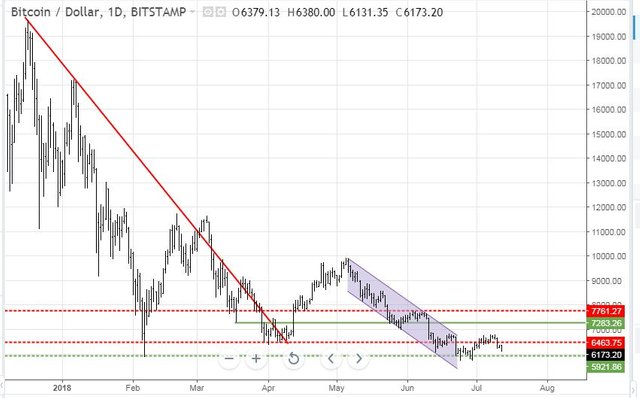
Bitcoin (BTCUSD): Price range for the day and a half was $269 (4.2% of the high). July 11 was a quiet day apart from being my eldest brother's 70th birthday. The first part of July 12 has not been that way with a followup drop in price to July 10 price action. Price was taking a rest on its road back to support.
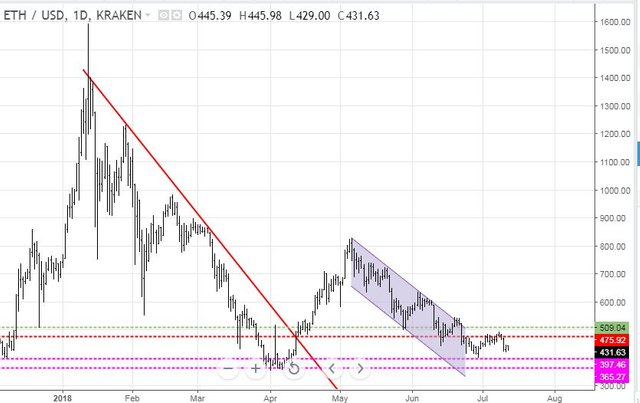
Ethereum (ETHUSD): Price range for the day was $23 (5.1% of the high). Price has behaved differently to Bitcoin with July 12 price currently still forming an inside bar. It looks to me like there are some buyers here who have been scared off Bitcoin.
CryptoBots
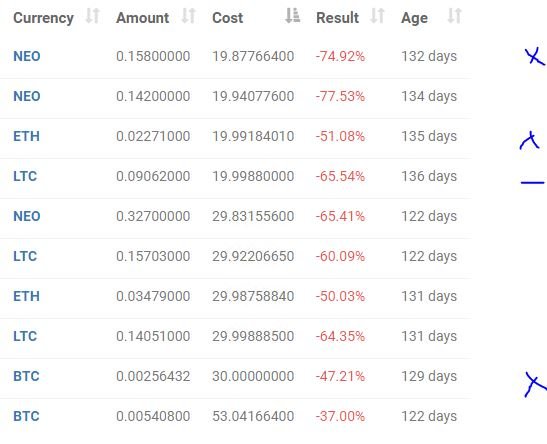
Outsourced Bot No closed trades. (213 closed trades). Problem children was unchanged (>10% down) - (18 coins) - ETH, ZEC (-53%), DASH (-54%), LTC, BTS, ICX (-53%), ADA (-49%), PPT (-62%), DGD (-55%), GAS (-67%), SNT, STRAT (-56%), NEO (-62%), ETC, QTUM (-54%), BTG (-63%), XMR, OMG.
GAS dropped hard to be the worst at -67%.
Profit Trailer Bot No closed trades. Dollar Cost Average (DCA) list was increased to 2 with ZEC joining the list. NANO did execute the first level of DCA.
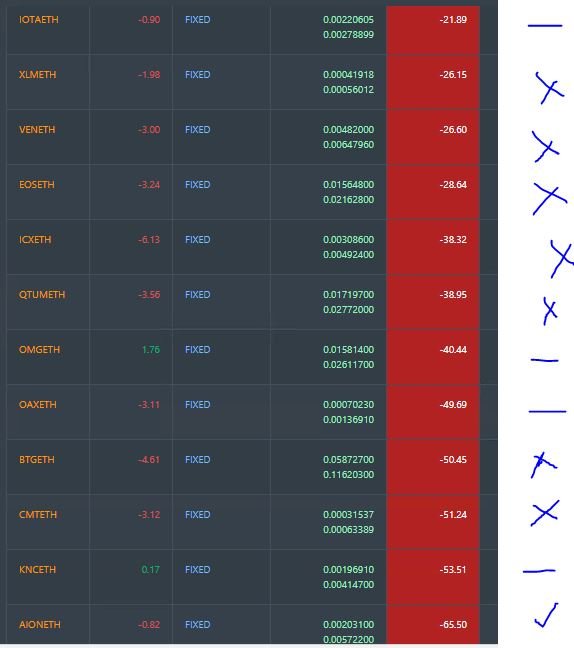
Pending list was unchanged at 12 coins with 1 coin improving (AION), 4 trading flat and the remaining 7 worse.
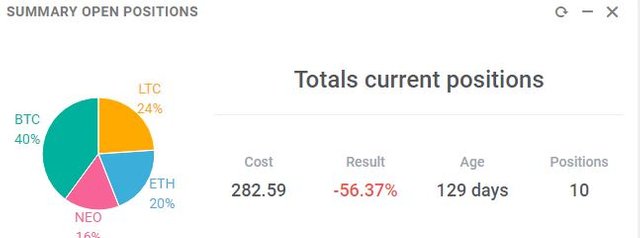
New Trading Bot Positions dropped 1 point to -56.4% (was -55.1%)
LTC traded flat since last report and ETH, LTC and BTC all went down a little more.
Currency Trades
Forex Robot did not close any trades and is trading at a negative equity level of 3.3% (higher than prior day's 2.8%).
Cautions: This is not financial advice. You need to consider your own financial position and take your own advice before you follow any of my ideas
Images: I own the rights to use and edit the Buy Sell image. News headlines come from Google Search. All other images are created using my various trading and charting platforms. They are all my own work
Tickers: I monitor my portfolios using Yahoo Finance. The ticker symbols used are Yahoo Finance tickers
July 11, 2018


Awesome post and awesome insight.
"I am noticing in one of my portfolios that stock lending fees are growing dramatically on stocks I am lending out. This is also telling me a lot about the state of markets - more fear means more short selling means more stock borrowing fees available."
Downvoting a post can decrease pending rewards and make it less visible. Common reasons:
Submit
Dramatically measured - twice as high in June as they were in May
Downvoting a post can decrease pending rewards and make it less visible. Common reasons:
Submit
What do you think about the US Banks? I think the tops are in for them and I'm about to short the XLF based on my most recent post.
https://steemit.com/stock/@rollandthomas/the-charts-say-sell-bank-stocks
Downvoting a post can decrease pending rewards and make it less visible. Common reasons:
Submit
3 charts starting with your short idea - Financials - lower lows and lower highs suggests a short.
Stripping out insurance and especially Berkshire Hathaway to banks ETF - KBE. We get a triangle with lower highs and higher lows = a level of indecision.
Now getting down to real banks that depend on interest rates and not trading and not M&A, the regionals - KRE
I see higher highs and higher lows and a MACD that is dropping but still bullish. We cannot say from technicals that regional banks are ready to cave.
As I look at banks - KBE, I cannot say they are ready to cave until I see the 0.618 and the 0.768 Fibonacci levels broken. This is the level they have been testing.
Same applies to Financials XLF testing the 0.618 again on a weekly chart.
Now there are two, maybe 3, questions that arise from the charts.
There is a 3rd question relating to trading income and M&A deal flow. All the results reported show this is going up. Maybe not the time to short the money centre banks just yet.
As to my portfolios, my most recent trade is long XLF for a bounce back to recent highs. I continue to write calls against my longs in Bank of America and Wells Fargo. I will let the market choose the exit point.
Downvoting a post can decrease pending rewards and make it less visible. Common reasons:
Submit
I can only watch the market situation today.
Thanks @carrinm has been shared. best regards @carrinm for you. I still support you.
Downvoting a post can decrease pending rewards and make it less visible. Common reasons:
Submit