Tariffs are great, says the man. The markets like data better. Bitcoin clears $8000 without looking back. China takes action to stimulate. Trade action is in UK, China, midstream oil and profits banked in Europe and US Dollar.

Portfolio News
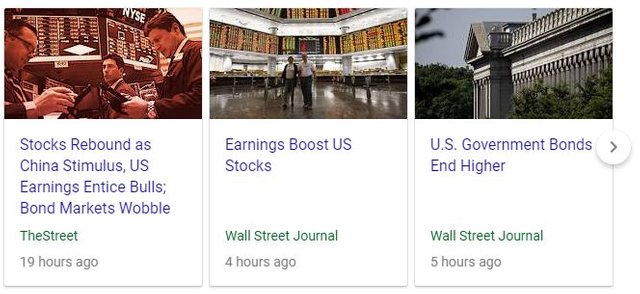
Market Jitters - Tariff Tantrum I watched markets open with Google results propelling tech stocks and financials improving on the back of rising yields.
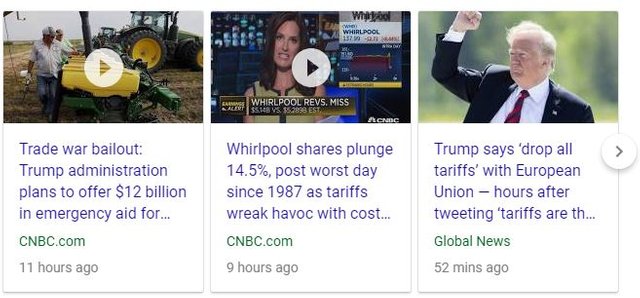
Interest rate action worked its way through all financials stocks from Japan to Europe to US. The patterns I highlighted last week are holding true. The tariff rhetoric shifted focus a bit as Donald Trump prepares to host EU Trade Commissioner, Jean-Claude Juncker in Washington. He said that "tariffs are great" and was looking for Europe to open up its markets or face tariffs - automotive was hot on his lips (though auto stocks all improved on a buyers day)
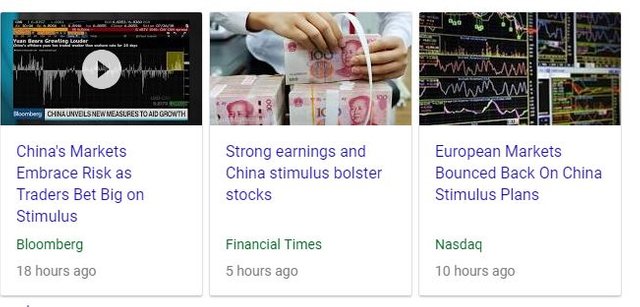
Oil prices popped again as inventory stockpiles dropped. The important news though was China stimulus.
The package was wide ranging
- More proactive fiscal policy (read tax cuts)
- Increase of medium term lending facility to banks (read lend more bank man)
- Soften regulation of wealth management (read less pressure on shadow banking)
- Set the reference rate for USDCNH above 6.70 for the first time for a while (read softer currency)
Bought
One of the talking heads was commenting about how US stocks, even small cap stocks (the Russell 2000), were looking somewhat over valued. He did think there was value in emerging markets small caps. Then he gave two examples from United Kingdom, WPP and Royal Mail. Two thoughts came to mind. 1. They are not small caps. 2. UK is not an emerging market. Now when an American talking head tells me that stocks outside the US are worth looking at, I pay attention.
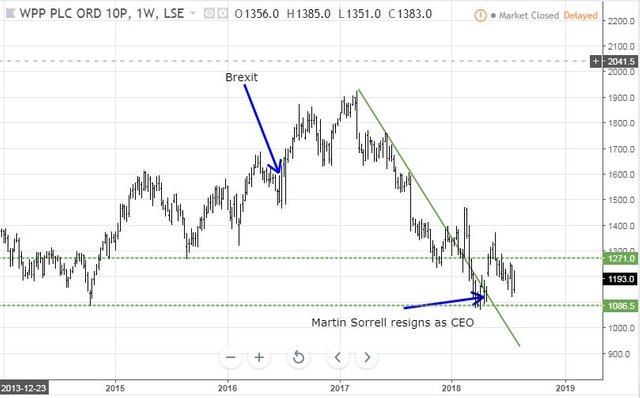
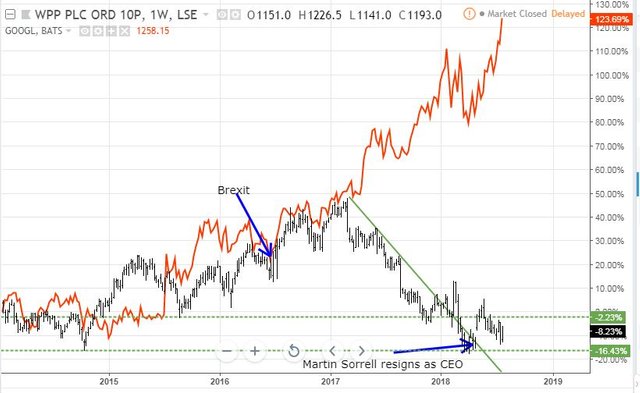
WPP plc (WPP.L): UK Advertising. WPP is one of the largest buyers of advertising on Google. The thesis was that anything that was working on Google, who announced great results, would work on WPP. I looked at the chart and bought a small parcel of shares with Pounds I had in one portfolio. The chart shows a solid build to the 2017 highs and a steady decline since then. The resignation of long time CEO, Sir Martin Sorrell in April 2018, arrested the decline. As often happens price recovered and then pulled back again. I am looking for the rebound, which may only happen at the lower support line.
Now I did check after the event the correlation to Google's parent, Alphabet (GOOGL - the orange line). It was tracking along perfectly and then something happened very dramatically in WPP to change the dynamic in early 2017. What the new CEO needs to do is figure out what went missing and put it back. I did check the chart against UK economy - it was not that.
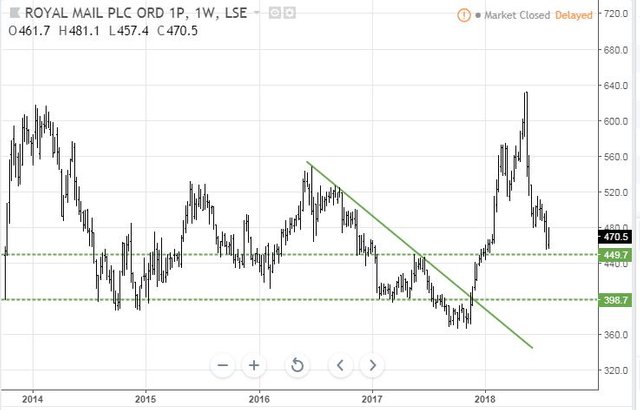
Royal Mail plc (RMG.L): UK Postal Service. The thesis was that the growth of Amazon will boost parcel deliveries for Royal Mail, now a privately held listed business, and replace revenues lost from declining letter service.
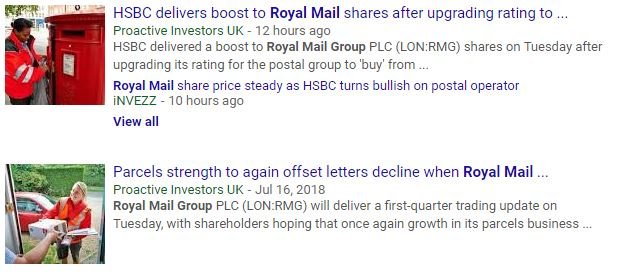
The chart tells a story of a stock that was improving strongly and then fell over. The trade feels like catching a falling knife. The 2017 reversal may provide a support level for the reversal. A broker upgrade during the day might prove some support too.
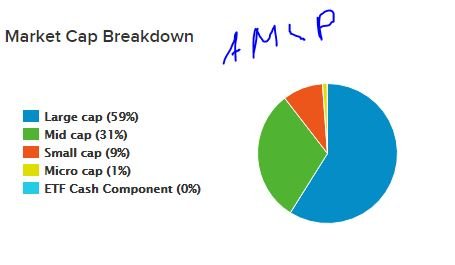
Alerian MLP ETF (AMLP): US Midstream Oil. I have been using the NYSE Pickens Energy ETF (BOON) as a way to reduce company specific risk in US midstream oil. A friend pointed me to an alternate ETF which is much cleaner - it focuses on midstream oil only. It is a market capitalisation weighted ETF and holds only 27 stocks [Means: stocks are weighted by their respective company size measured by market capitalisation]. The mix of sizes shows that this is a solid way to reduce company specific risk - there is only a small weighting to small stocks.
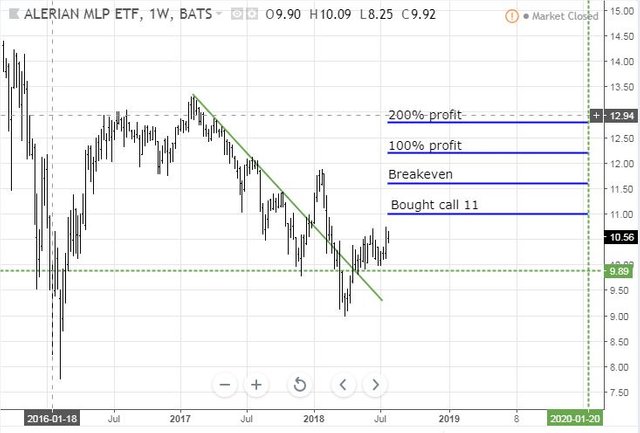
I bought a parcel of stock in two portfolios. What I liked also is there were options markets going out to January 2020. BOON has none. I added to all of my portfolios a one strike out-the-money January 2020 strike 11 call option for a premium of $0.60 (5.4% of strike) - I thought that was very cheap. Let's look at the chart which shows the bought call (11), breakeven, 100% and 200% profit as blue rays with the expiry date the dotted green line on the right margin.
The key takeaways for me is price has bounced off the 2018 lows and has tested a support line a few times. The 2018 highs are above breakeven and the 2017 highs are above the 200% profit level. That makes the options trade look comfortable. Add in the 7.94% dividend yield for the ETF holding - it feels right. Note: MLP's have a different foreign tax withholding to normal stocks - it is 30%.
A quick reminder on the thesis for midstream oil. As oil demand grows, shale oil producers are highly geared to rising oil prices. Holding the ETF means I do not have to do the research to see which businesses have hedged their oil exposure - that effect will be blended in. There is a good analysis of AMLP in this article published yesterday and also of the top 5 holdings in the ETF.
https://seekingalpha.com/article/4189141-amlp-finally-ready-move
My plan is now to use this ETF more than BOON - I will sell down some of the BOON holdings.
Alloy Resources (AYR.AX): Australian Cobalt/Gold Mining. I have had a long standing bid in on this cobalt explorer to average down my entry price. See TIB24 for the initial discussion. I am waiting patiently for Alloy Resources to prove its cobalt resources that are adjacent to Cobalt Blue (COB.AX) whose price has rocketed since listing
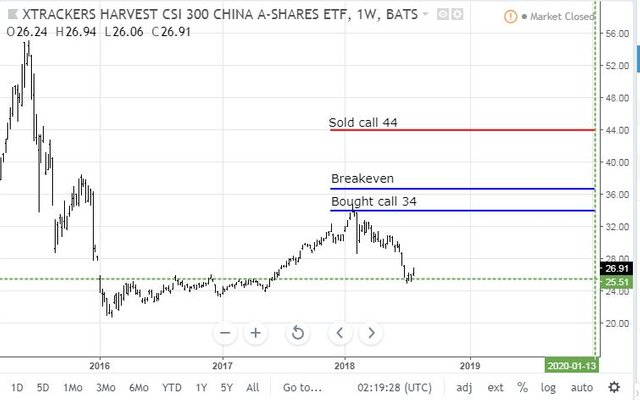
Xtrackers Harvest CSI 300 China A ETF (ASHR): China A Shares Index. Chinese stocks have been hammered in the tariff dispute and the emerging markets selloff. China announced a raft of stimulus measures which pepped up markets somewhat. My contrarian trades on China (see TIB240) are under water. I looked at the charts and decided to buy the ETF rather than work with options. This is going to be a long waiting game to benefit as new industries supplant old industries.
Simple chart update shows how sad the 34 strike call options are BUT it does show a bounce off a support level (dotted green line added today). Long may it last. The stimulus action shows that China has too much to lose to allow the tariff tantrum to derail what they are trying to achieve - a thorough modernisation of their economy.
Sold
Amsterdam Index (AEX): Sold December 2019 strike 500 call options for 32% profit since June 2015. This was along standing profit target as I remain exposed through December 2021 call options (same strike)
Income Trades
Two new income trades on stocks that I have written calls on previously but did not feature last month
FireEye, Inc (FEYE): US Cybersecurity. Sold August 2018 strike 18 calls for 2.88% premium (4.0% to purchase price). Closing price $17.00 (higher than last time). Price needs to move another 5.9% to reach the sold strike (tighter than last time). Should price pass the sold strike I book a 47% capital gain. Income to date amounts to 8.7% of purchase cost.
iShares MSCI Thailand Capped ETF (THD): Thailand Index. Sold August 2018 strike 90 calls for 0.35% premium (0.44% to purchase price). Closing price $85.79 (lower than last time). Price needs to move another 4.9% to reach the sold strike (easier than last time). Should price pass the sold strike I book a 31% capital gain. Income to date amounts to 1.17% of purchase cost.
Cryptocurency
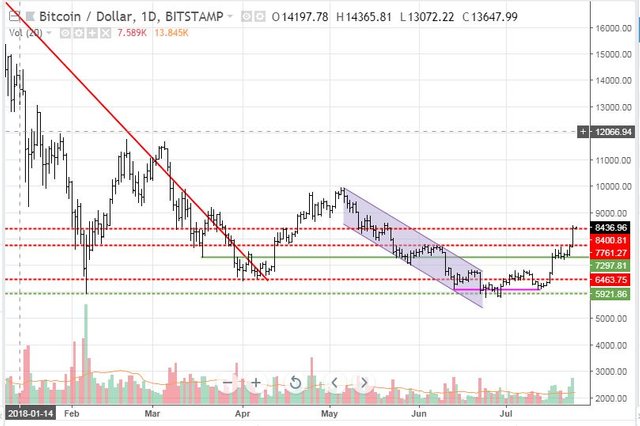
Bitcoin (BTCUSD): Price range for the day was $805 (10.5% of the high). The buyers arrived with some volume and drove price through resistance to test the next level up (top red dotted line I drew in today)
In my IG Markets account one contract hit its price target at $7925 for $282 per contract profit (3.7%). This has been a patient wait and pays funding costs for a little while longer.
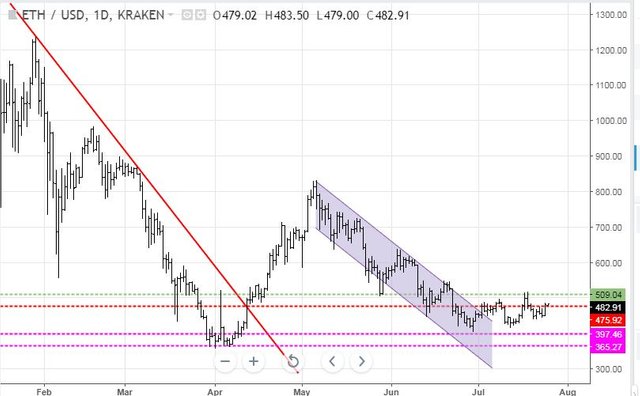
Ethereum (ETHUSD): Price range for the day was $37 (8.3% of the low). Price avoided the lower low and took out prior day high to close just above the resistance line. Do not be surprised to see price track Bitcoin higher, for the simple fact that 1 ETH costs $485 and not $8400
CryptoBots
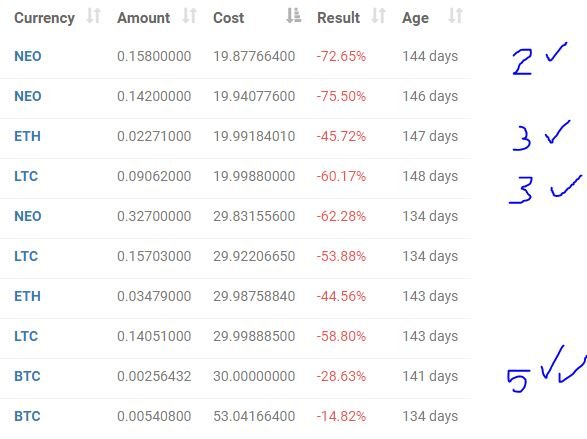
Outsourced Bot No closed trades. (213 closed trades). Problem children stayed at 18 coins. (>10% down) - ETH (-44%), ZEC (-50%), DASH (-60%), LTC, BTS, ICX (-66%), ADA (-47%), PPT (-73%), DGD (-63%), GAS (-74%), SNT, STRAT (-62%), NEO (-69%), ETC (-44%), QTUM (-62%), BTG (-66%), XMR, OMG (-46%).
DASH (-60%) and STRAT (-62%) both dropped below 60% down. GAS (-74%) remains the worst. The divergence continues with most coins dropping 1 or 2 points.
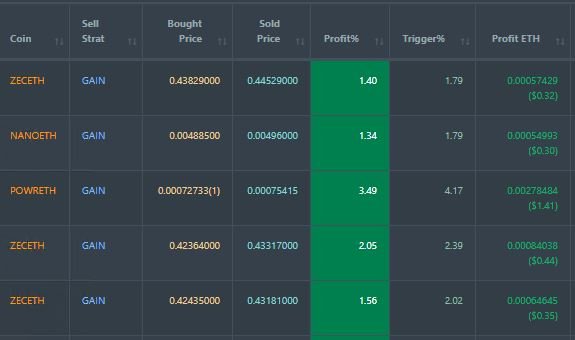
Profit Trailer Bot Five closed trades (1.97% profit) bringing the position on the account to 1.01% profit (was 0.92%) (not accounting for open trades).
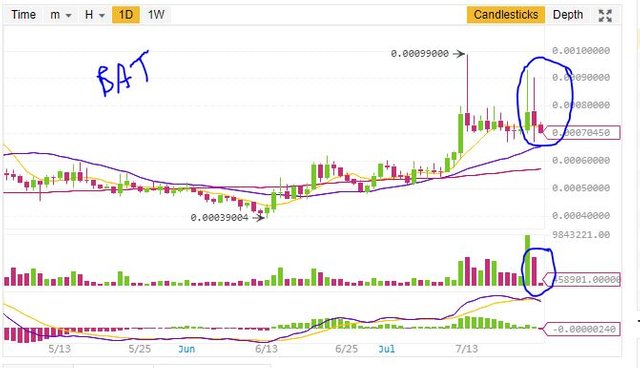
There are two coins on the Dollar Cost Average (DCA) list with POWR moving off death bed and onto profit after one level of DCA and BAT joining ZRX. BAT looks shakily close to stopping out but I said that about POWR yesterday which surged to win at 3.49% up. The chart suggests that this is profit taking after the strong run up with volumes quite high again.
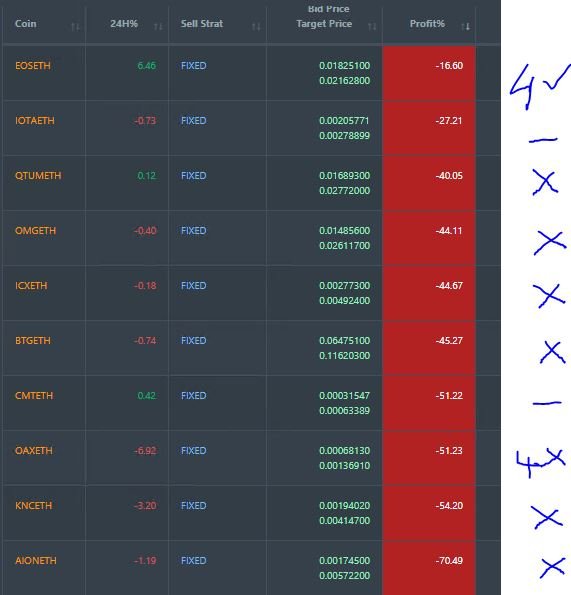
Pending list remains at 10 coins with 1 coin improving, 2 coins trading flat and 7 worse. Worst coin was OAX and best was EOS.
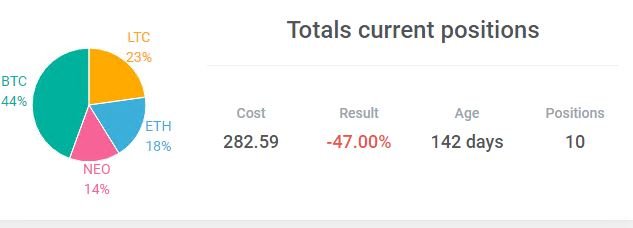
New Trading Bot Positions improved 3 1/2 points to -47.0% (was -50.7%)
Star of the show was BTC, up 5 points and the other coins all up 2 or 3 each.
Currency Trades
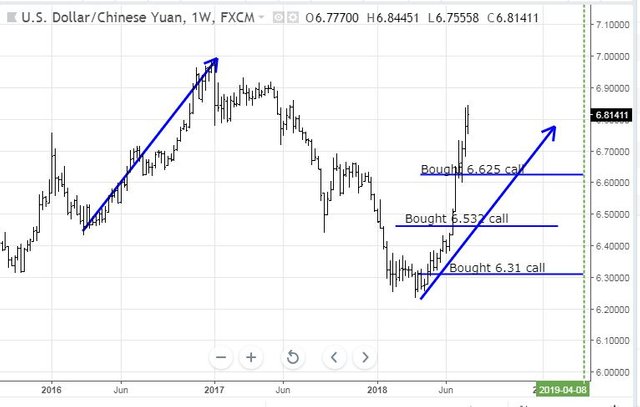
Chinese Yuan (USDCNH): I have been humming and ha-ing about taking profits on call options I hold on the Chinese currency. My investing coach was always saying to cut losers and let winners run especially if there was still time on your side. In one portfolio, I decided to take profits when they passed 200% even though there was still some time to go to expiry. The chart tells the story of price moving much more steeply than the price scenario I had modelled.
I closed the bottom contract for a 206% profit since April 2018. If the trade does run further, I still have two call options in place in one of my other portfolios. The talking heads are talking about 7 being the next level - that will bring my 6.625 strike call option to its 100% level.
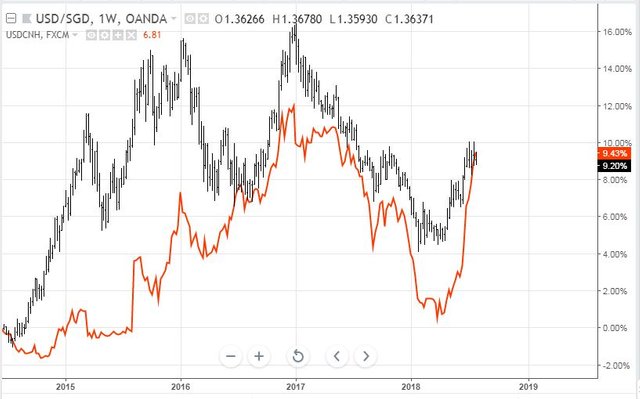
Singapore Dollar (USDSGD): I was watching a Real Vision piece about the risk from the trade war affecting Canadian Dollar and the Australian Dollar. The thesis was that both markets are strongly tied to China and have somewhat overvalued property markets. The trade idea was to short the Canadian Dollar. I was not happy to do that as a spike in oil prices will strengthen the Canadian Dollar. I am already short the Australian Dollar as most of my investments are outside Australia and I spend my money in Australian Dollars. Implied volatility on both currencies was higher than I like. What else? Implied volatility on Singapore Dollar was lower. It is tied to China quite strongly. The first chart checks the correlations (SGD - black bars: CNH - orange line) - looking pretty much the same a lot of the time.
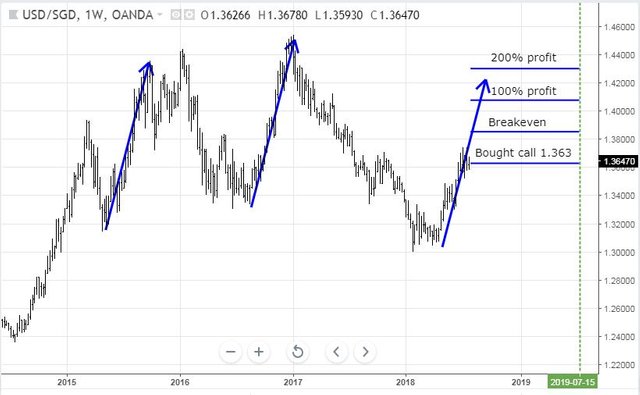
I bought 12 month to expiry call options on USDSGD at 1.363 strike for $0.02245 premium. Let's see how that looks on the chart which shows the bought call (1.363), breakeven, 100% and 200% profit as blue rays with the expiry date the dotted green line on the right margin.
I have modelled one price scenario (left hand blue arrow) which matches the next run up and mapped it across to the current price move. Get a repeat of that and trade will be close to 200% profit. If price reaches the 2017 highs, the trade will make 300% - highly achievable.
Risk in the trade is the tariff tantrum blows over or more importantly inflation goes soft in the US and the Federal Reserve slows down rate hikes.
Forex Robot did not close any trades and is trading at a negative equity level of 3.6% (lower than prior day's 3.9%).
Outsourced MAM account Actions to Wealth closed out 2 trades for 0.13% losses for the day.
Cautions: This is not financial advice. You need to consider your own financial position and take your own advice before you follow any of my ideas
Images: I own the rights to use and edit the Buy Sell image. News headlines come from Google Search. AMLP mix image comes from ETFDB.com. All other images are created using my various trading and charting platforms. They are
all my own work
Tickers: I monitor my portfolios using Yahoo Finance. The ticker symbols used are Yahoo Finance tickers
Charts: http://mymark.mx/TradingView - this is a free charting package. I have a Pro subscription to get access to real time forex prices
Crypto Trading: get 6 months free trades with Bitmex for leveraged crypto trading.
Bitcoin: Get started with mining Bitcoin for as little as $25 http://mymark.mx/Galaxy
July 24, 2018
so to ponder - do I add to my own AYR holding?
Downvoting a post can decrease pending rewards and make it less visible. Common reasons:
Submit
This is a sit and wait game. My trade was at $0.007 per share and it sat there for some weeks. Maybe the way to play this is to put in a bid at $0.005 or $0.006 or even $0.004 good to cancel and just wait. All you have to be aware of is the risk the business runs out of cash - and you get hit on your bid the day that happens. That $0.001 is 14% price move from the last trade at $0.007
Downvoting a post can decrease pending rewards and make it less visible. Common reasons:
Submit
Great analysis as always! Interesting to see both China and US trying to stimulate their economies when they are celebrating the fact that they are growing GDP above targets. There are keeping things from the general panic as they try to creat a better normalization as their central banks focus on reducing their balance sheet.
Downvoting a post can decrease pending rewards and make it less visible. Common reasons:
Submit
I think there is a difference in thinking. China is trying to modernise their economy. It is also trying to integrate the Silk Road economies through infrastructure. By definition this is stimulatory.
What I see the US doing is simple stimulus - tax cuts and monetary stimulus. There are some spending measures but they are not yet focused on building/modernising other than for defence. That will come as Donald Trump has been very consistent in coming back to his list of campaign promises. He did promise infrastructure spending.
Downvoting a post can decrease pending rewards and make it less visible. Common reasons:
Submit