Holiday time was time to reflect on expiring options and write covered calls. Markets were too ugly to trade.

Portfolio News
Market Selloff
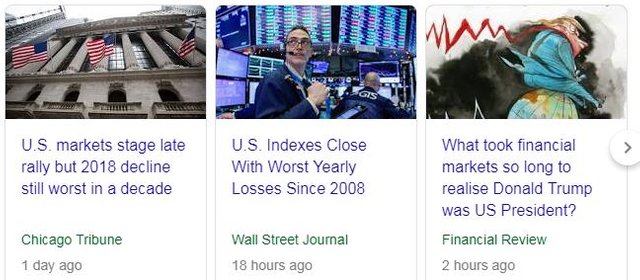
Holiday markets were horrible with the worst Christmas Eve ever and wild swings in between.
The market is beginning to really question Donald Trump - markets really do hate the vagaries of a maverick that shoots from the hip.
Takeovers The cannabis carnival continues with a hostile bid for Apria (APHA.TO). Market price reaction is assuming the deal will not happen as price has not risen to the offer price.
https://www.cbc.ca/news/business/green-growth-brands-aphria-takeover-1.4960178
Earthport plc (EPO.L): Europe Payments. Visa (V) makes a bid for Earthport = good news for my holding which now goes into positive territory. Price is currently trading below the offer price.
Expiring Options
Options expiry time is always a sobering time to reflect on trade strategies and trade management. I will review each of the expiring options with that in mind.
Four primary threads have dominated my thinking and come largely from my investing coach.
- Buy one strike out-the-money [Means: Buy a call option at the strike price above the current price]
- Roll up to the next out-the money option when price passes strike price (provided you remain happy to be in the trade. The test: Would you open a new trade at that time?). My coach likes to scale in when he rolls up - i.e., he puts all the proceeds including the profit into the rolled up trade. Mostly I do not do that - I keep the same number of contracts so I do bank some profits along the way.
- Buy more time if you are running out of time and you are happy to remain in the trade.
- Let options run to expiry -i.e., no premature closes for profits or losses. He did not want to miss out on losers that become runaway winners. I have done the analysis once some time ago - he was right then. My review suggests a need to have a let winners run strategy when markets are rising and a more cautious approach when markets are choppy or falling.
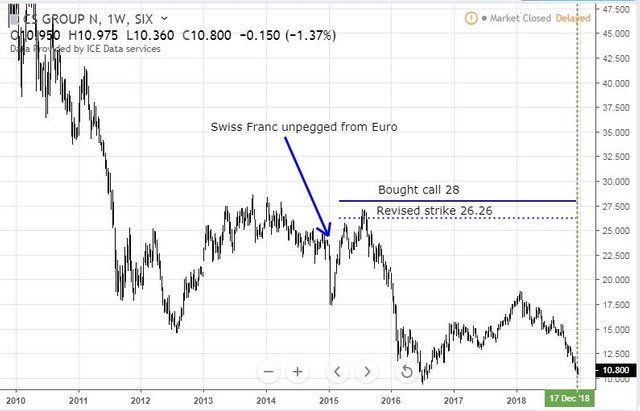
Credit Suisse Group AG (CSGN.VX): Swiss Bank Strike 28 (revised to 26.26 after dividends) call options bought March 2015. The trade idea was based on rising interest rates improving profit profiles of banks and a continuation of the recovery in Swiss bank stocks following the break of the Euro Swiss Franc peg.
The chart shows that price did continue its recovery until the middle of 2015 and then fell off a cliff as new CEO Tidjane Thiam started a massive restructuring of the business. What the chart shows is how effectively the Swiss National Bank has been able to keep its negative interest rate policy working all this time. Negative rates are challenging for bank profits.
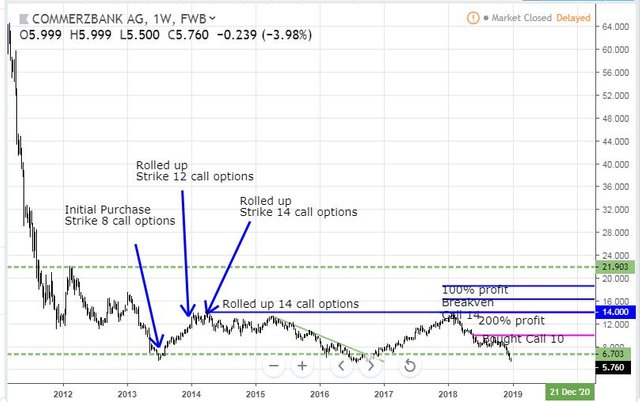
Commerzbank AG (CBK.DE): German Bank. Strike 14 call options rolled up in March 2014. The first trade entry caught the bottom of the cycle for Commerzbank almost to the day. The chart shows the strategy of keeping rolling up and staying out-the-money with roll ups from 8 to 12 to 14 strike. These 3 trades were profitable yielding a 28% profit on the initial trade despite losing all the premium on the last leg.
The early part of the chart shows the price target potential is absolutely massive - even getting back to 2012 highs would have been massive. What went wrong? European Central Bank (ECB) went soft on rate hikes in early 2018 when the market was showing signs of strength - that just pushed all European banking stocks back down and they have not recovered.
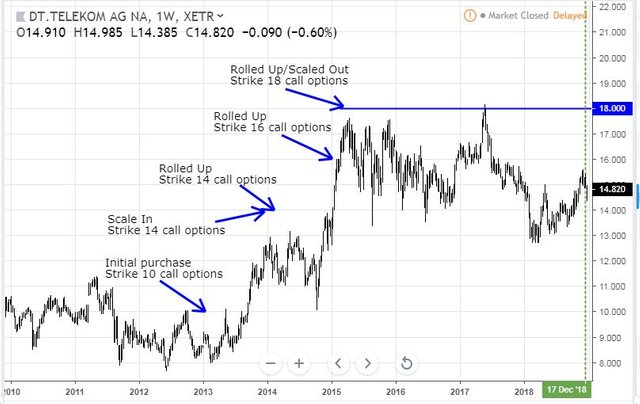
Deutsche Telekom AG (DTE.DE): German Telecom. Strike 18 call options rolled up in March 2015. The chart shows classically the strategy. Pick a stock that is beaten up and showing signs of recovery.
Keep rolling up and buying more time as price recovers in this case 3 times plus one scaling in. At the last rolling up, I did scale back position size to bank profits. The results table shows a healthy 360% profit despite losing all of the last leg.
I remain exposed to December 2019 strike 20 call options which are now well out-the-money. With better review now done I can manage trade exit to recover some of the premium as it does not look like a winner from here. That said, I could well win with some longer dated options trading the current break up - time to review the story coming from the Telkom US holdings DTE has.
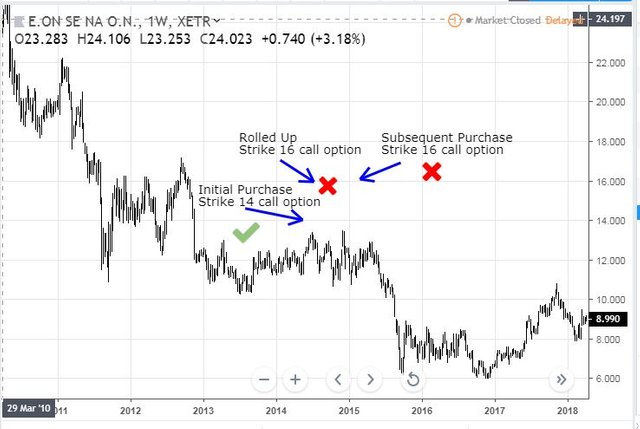
E.ON SE (EOAN.DE): German Utility. Strike 16 call option bought in March 2015. Trade idea from investing coach which had shown signs of breaking up once before.
The chart shows the whole history with the first trade rolled up at a profit and then expiring at a loss. [Arrow point is entry date and strike level]. The subsequent trade shows the trade entry concept of being one strike out-the-money (16 vs 14) and an uptrend making higher highs. Looking back it is clear that the 2nd trade should never have been entered after the 1st roll up failed and I should have hit the exits when price made a lower low in Q2 of 2015.
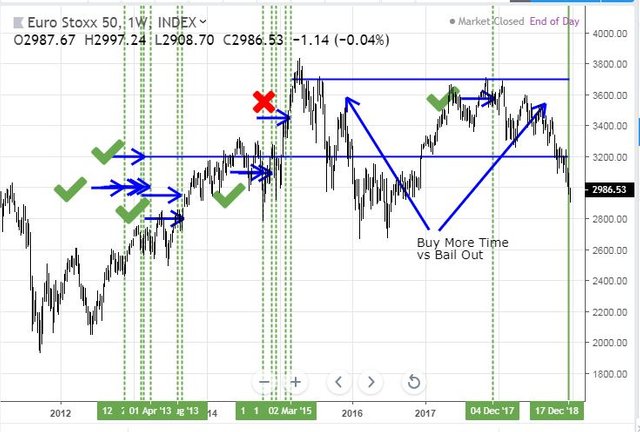
Eurostoxx 50 (FEZ): Europe Index. Sets of 3200 and 3700 strike call options bought in Q1/2 2014 and Q1/2 2015. The main thesis for investing in Europe was its markets could close some of the gap to the US after the end of the European Debt Crisis in 2012. The trade vehicle was options on the Eurostoxx50 index itself listed in Germany. Contract size is large but long timescales were available way longer than one could get in US markets.
The chart is a little complicated and goes back to the debt crisis lows. All the trades not expiring this time are shown as blue arrows - the point of the arrow is the time of opening and the level of the arrow is the strike. The contracts that have expired this time are shown as blue rays with the opening time the start of the ray and the level the strike.
First 10 trades all closed profitably on exit (either rolled up or closed). 11th trade was a loser (red X marks that) with the 12th trade done in December 2017 also a winner. To note is first trade entries were after price had made a higher high after the 2012 lows (i.e., after the debt crisis). The 3200 strike calls (1st opened in March 2014) were profitable more than half the time. The trade management questions then are should one have exited with profits, or bailed out when price made a lower low in Q3 of 2015? It is hard to be buying more time with more than two years to expiry. There is no doubt that there was a chance to buy more time in mid 2018 with say a quarter to go to expiry, while still in-the-money. The truth is it is really hard to add more premium to a contract that is in-the-money - it is better to simply buy the underlying stock.
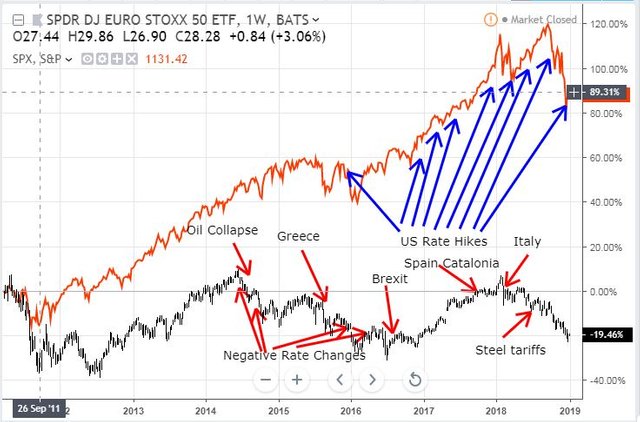
The 3700 strike calls pose quite different questions. Was the run past 3700 in late 2015, the end of the run? That level was only ever tested 4 more times but not passed. The charts do not carry the answers - it is a question of fundamentals. To understand this I have gone back to chart the thesis that Europe could close some of the gap to the US. The chart shows a Eurostoxx50 ETF (FEZ - black bars) compared with the S&P500 (orange line) - all in US Dollars.
I did also compare the chart with Dow Jones Industrial Index which matches Eurostoxx50 better in mix but the story does not differ. From the 2012 debt crisis lows, Europe was tracking the US (but not closing the gap). That all changed in early 2014 when the ECB first introduced negative interest rates. This immediately hit the banks and insurance companies which make up 17% of the index. The ECB has made 4 changes in negative rates (they are each shown) and every time the index has slid further. Energy is 7% of the index and the oil price collapse of 2014 had its impact just as the ECB dropped rates. Lay in the crises in Greece, Brexit, Spain and Italy to the ECB muddles and the story is told. The final straw is the imposition of steel tariffs by Donald Trump in July 2018 and the escalation of a trade dispute with China sparking a global selloff.
So the thesis was Europe could close some of the gap to the US. The hard reality is Europe went up 23% from the debt crisis lows and US went up 120% - this has been a clear case of Europe Muddles. My sense is it is going to get worse as the ECB has painted itself into a corner - it has negative rates at a time when it might have to start stimulating again in the face of a global slowdown driven by the US-China trade war.
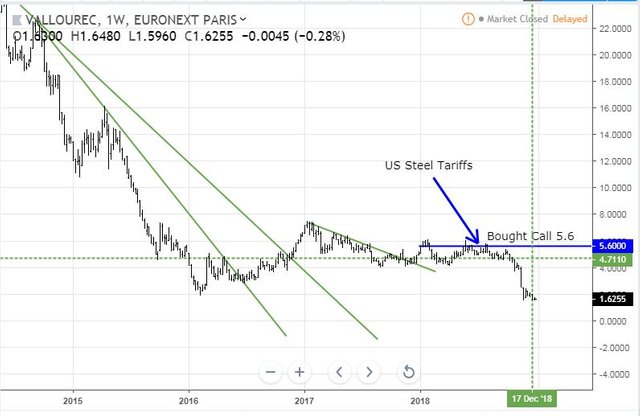
Vallourec SA (VK.PA): French Industrials. 5.6/8 bull call spread bought in January 2018. Bought as a Price to Book stock which was breaking out. The chart shows the trade was just holding water around the bought strike (5.6) and was then smashed by US tariffs on steel.
That was a trade management failure as the market dynamics were changed by the tariffs. There was a window to escape when price stuck its head above the bought strike level once. I chose not to as I felt Europe growth was strong enough in mid year to sustain the recovery.
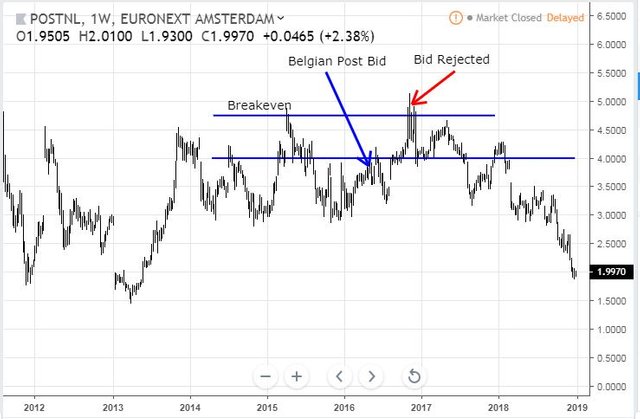
PostNL N.V (PNL.AS): Dutch Postal Service. Strike 4 call options bought in April 2014. The trade management tale here is Post NL was subject to takeover offer by Belgian Post. Normally I exit when there is corporate action like this - I did not and lost the opportunity when the deal fell through. The next trade management lesson is I got the chance to recover some premium when price stuck its head above the bought strike in early 2018. It has been downhill ever since.
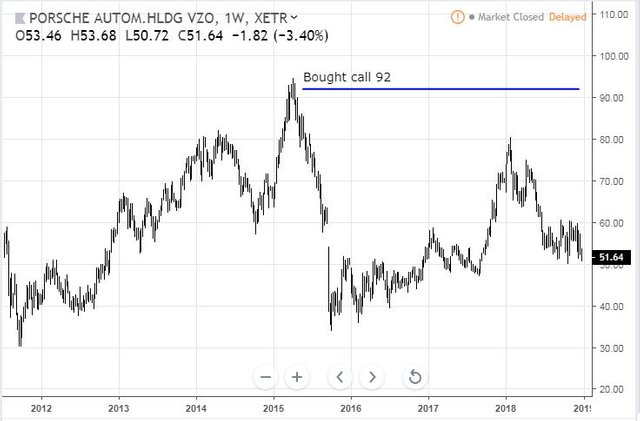
Porsche Automotive Holdings (PAH3.DE) Strike 92 call options bought in May 2015. This was a trade idea from my investing coach predicated on growing demand from China for Porsche cars and some success we had had with investing in Volkswagen and Daimler and Fiat Chrysler.
The chart tells its own story. Trade was entered during a long run from the 2012 lows in a belief that global growth could keep the trend running. Bad trade.
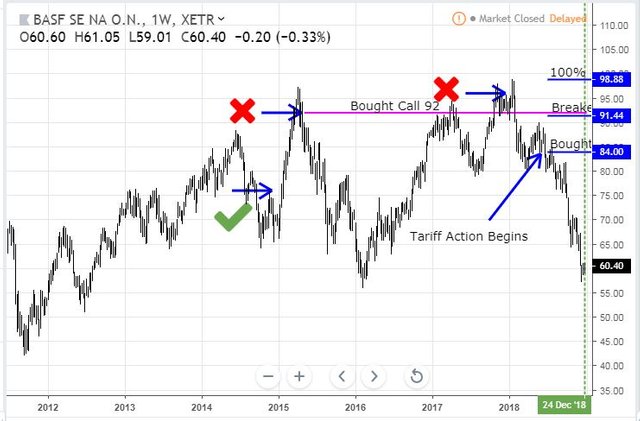
BASF SE (BAS.DE): German Chemicals. Strike 92 call option rolled up May 2015. The trade story here is of getting into the flow of an uptrend from the 2012 debt crisis lows and winning on the first cycle up and never maintaining the momentum after testing above the 92 strike a few times. The US-China trade dispute then killed the trade off.
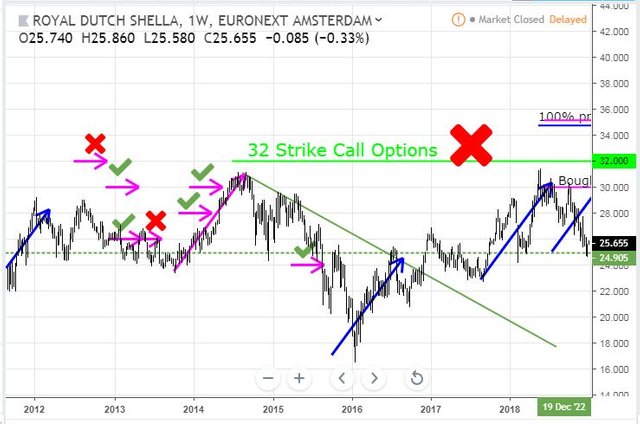
Royal Dutch Shell plc (RDSA.AS): Europe Oil Producer. Shell provides a strong way to invest using options in oil because it has options going out up to 4 years in advance, longer than any other oil stock. On the chart I have marked in all the closed trades using a pink arrow to mark the strike (level) with the point of the arrow the start date.
1st trade was a losing trade as the 1st strike out-the-money (32) was too far ahead of the possible price momentum with price around 28 at the time - a strike 30 is not always available. Trade action from here was a series of trades basically riding up from below 26 to above 30 with 5 consecutive winning trades and only one more loser. The trade that just expired was a rolling up of 3 trades into 32 strike (the green ray) looking for the pink arrow price scenario to keep going. With 4 years to expiry there was enough time for the trade to weather the 2014 oil price collapse but not enough to deal with the 2018 collapse.
Trade management action would have been to salvage some premium when price made a lower high in Q3 2018 - but nobody was expecting the oil price collapse to flow through the way it did, especially not for an integrated producer like Shell. I remain exposed through 2022 call options and I do hold he stock in one of the portfolios.
Income Trades
5 orders taken up for January expiry covered calls. Implied volatility has risen with all trades coming in over the 1% target. I will tweak entry prices when markets reopen after the holiday period. See the table below which shows purchase price and closing price, the premium received and the % relative to close and to purchase price. The strike is shown and the important columns after that are the amount price has to move to reach the strike price - you will see they are all around 5% with a few more than that. The net cost column is updated each month to show purchase price less accumulated premium received - the percentage column at the end shows what contribution income has made compared to purchase price.
Sprint (S) trade is a new trade and was done at a too tight strike price - I meant to write at 6.2 strike instead of 6. The premium received will make the overall trade just profitable if the stock is assigned at expiry.
Cryptocurency
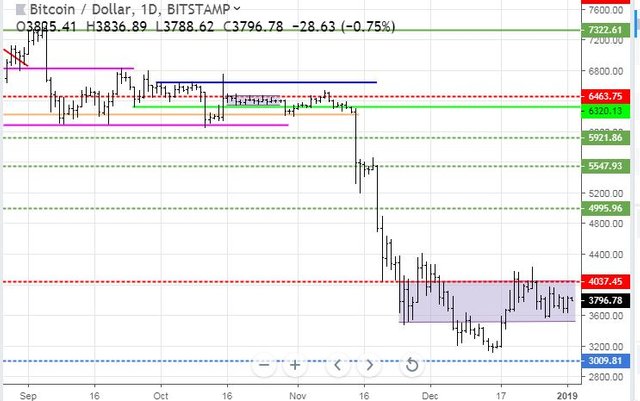
Bitcoin (BTCUSD): Price has traded in the range between $3600 and $4000 for the two weeks since my last report.
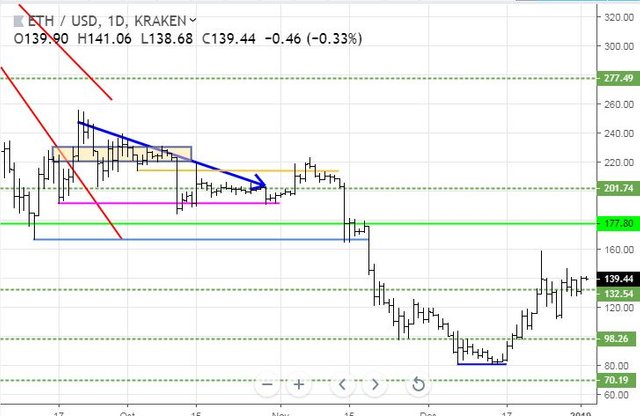
Ethereum (ETHUSD): After testing the $100 support level price has pushed up to the next resistance level at $132 and now trying to hold above that for a test back to $160 tested on one day last week (December 24)
CryptoBots
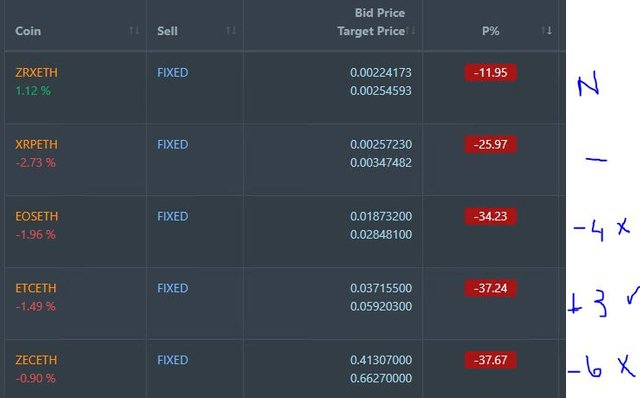
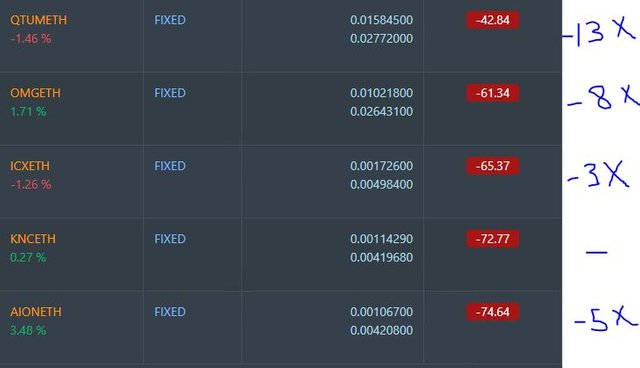
Outsourced Bot No closed trades. (222 closed trades). Problem children remains at 19 coins. (>10% down) - DASH (-72%), ETH (-64%), ZEC (-71%), AE (-43%), LTC (-50%), BTS (-68%), ICX (-86%), ADA (-72%), PPT (-85%), DGD (-85%), GAS (-88%), SNT (-67%), STRAT (-64%), NEO (-85%), ETC (-62%), QTUM (-77%), BTG (-72%), XMR (-54%), OMG (-76%).
Coins moved in a wide band, mostly down. AE dropped 9. GAS (-88%) remains the worst coin. DASH (-72%), ZEC (-71%), LTC (-50%), AE (-43%), STRAT (-64%) all dropped a level
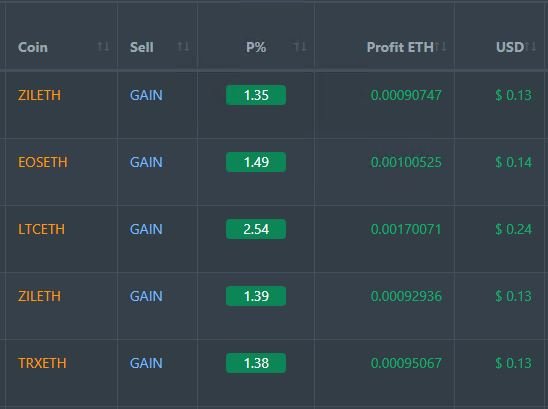
Profit Trailer Bot Five closed trades (1.63% profit) bringing the position on the account to 5.19% profit (was 5.09%) (not accounting for open trades) after opening up trading to allow 6 pairs.
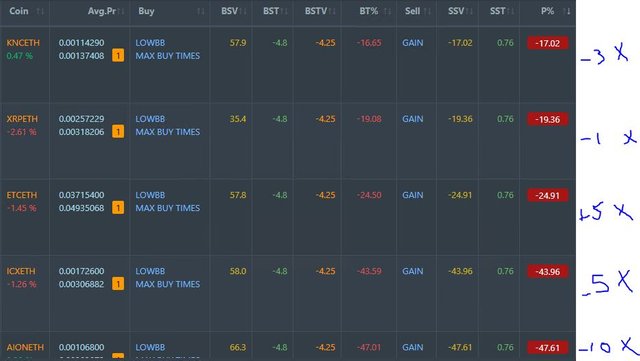
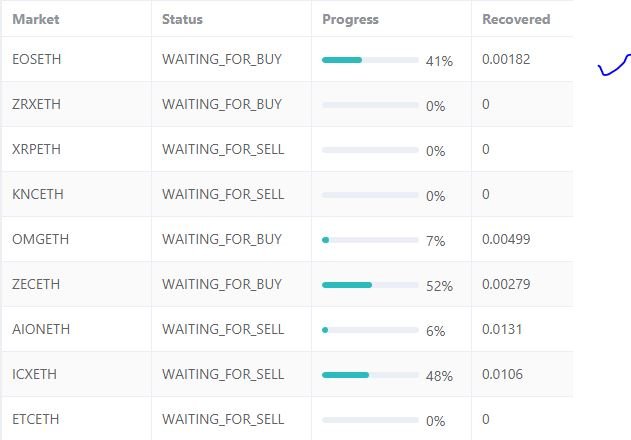
Dollar Cost Average (DCA) list remains at 5 coins with only one coin improving (ETC) and all coins at one level of DCA
Pending list extends to 10 coins with ZRX added to PT Defender and 1 coin improving, 2 coins trading flat and 6 worse. There appears to be a clear divergence in coin performance with laggards really dragging down - might be time to cut some losses and rebuild.
PT Defender now defending 9 coins with ZRX added. one winning trade made on EOS.
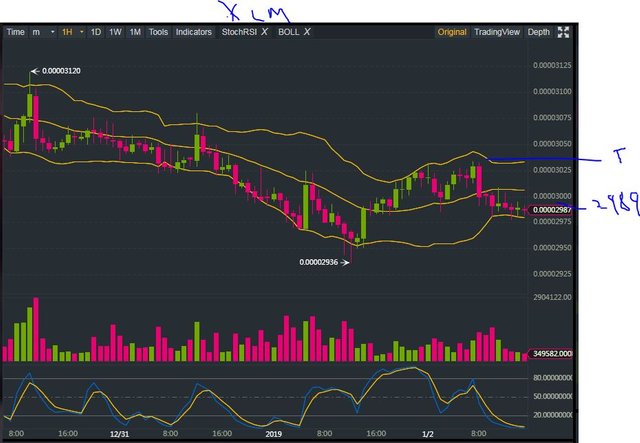
New Trading Bot Trading out using Crypto Prophecy. No closed trades. Trades remain open on SC, FUEL, VET and XLM. Added one more DCA trade to XLM
Currency Trades
Forex Robot closed 2 trades (0.12% profit) and is trading at a negative equity level of 2.0% (higher than prior 1.86%).
Outsourced MAM account No Actions to Wealth closed trades - holiday time.
Cautions: This is not financial advice. You need to consider your own financial position and take your own advice before you follow any of my ideas
Images: I own the rights to use and edit the Buy Sell image. News headlines come from Google Search and Reuters. All other images are created using my various trading and charting platforms. They are all my own work
Tickers: I monitor my portfolios using Yahoo Finance. The ticker symbols used are Yahoo Finance tickers
Charts: http://mymark.mx/TradingView - this is a free charting package. I have a Pro subscription to get access to real time forex prices
December 22-31, 2018



Thanks for sharing your valuable insights from the markets always :) wishing you a very happy new year :)
Downvoting a post can decrease pending rewards and make it less visible. Common reasons:
Submit
Thanks and to you and yours a very good new year.
Downvoting a post can decrease pending rewards and make it less visible. Common reasons:
Submit
Great guidance in options strategy as emotions sometimes get in the way of the plans! However, rolling trades forward in this market is more expensive given volatility so one must be committed to the direction of the trade in my opinion. Thanks!
Posted using Partiko iOS
Downvoting a post can decrease pending rewards and make it less visible. Common reasons:
Submit
It is no surprise that most of my new options trades are spreads.
Downvoting a post can decrease pending rewards and make it less visible. Common reasons:
Submit