Markets cope with bad chip news surprisingly well. Some profit taking in banking and capital protection in real estate. Markets look for yield again. Busiest trade corner is on cryptospace with Bitcoin making a rocket move over the weekend.

Portfolio News
Market Rally
Markets did take a dip on the back of the Broadcom (AVGO) earnings release.
The impact on their business from Huawei is much bigger than markets thought. The market reaction on Friday was surprisingly muted given the extent of the Huawei impact on the semiconductor sector.
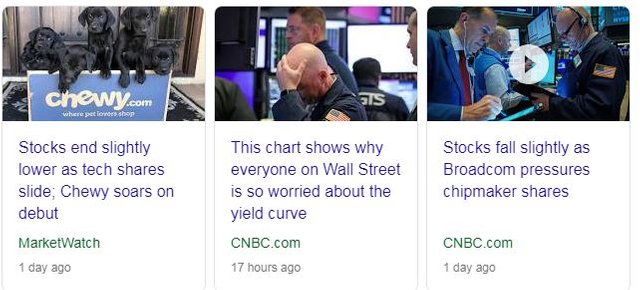
I did have a look at the article about the chart everyone is worried about. It is the relationship between the yield curve and the next 12 months returns on S&P500. The challenge is one of timing. The inversion of the yield curve does tell one there is something not quite right. What it does not tell you is "when". Here is the key quote.
Going back to 1986, when the yield curve turned flatter drastically and eventually inverted, the S&P 500 tends to go into a downward spiral within the next 12 months
No data given about the recessions before 1986 (only been 3 since 1986). I did listen to one of the talking heads last week saying the inversion needs to last a few more weeks than it has currently (maybe even months).
Read and make up your own mind. There is no doubt the time for being cautious is upon us. Of course, a China trade deal will change all of that. Wilbur Ross, US Commerce Secretary was being cagey about the prospects ahead of G20 meetings. That man bothers me - reminds me of a doddery old man not quite living in 21st century
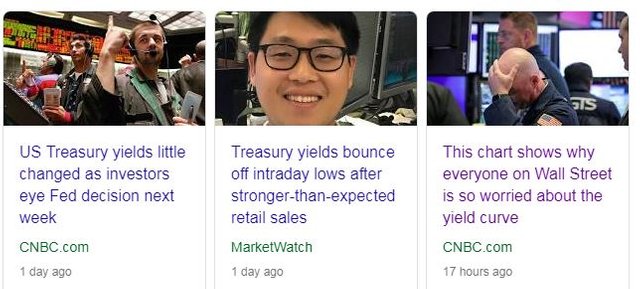
In the grand scheme of things, yields did not budge much either.
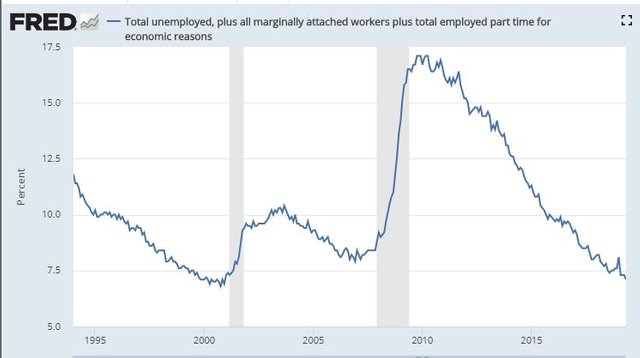
They are waiting for the Federal Reserve meeting next week. Time to have a look at a key chart the Fed watches - the U6 rate.
There is not a lot of room left to find workers. Current rate is 7.1% with the low before 2008 crash 7.9% and 6.8% before the 2000 crash. Of note this time is inflation is muted - wages can still move up.
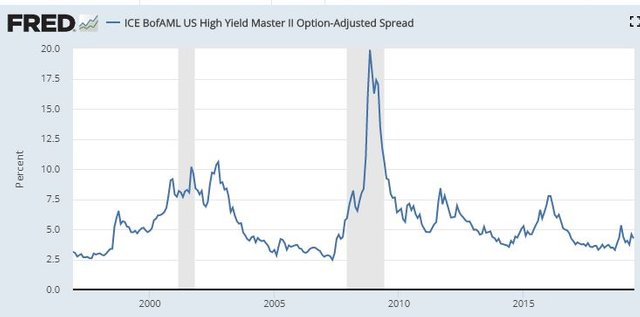
While we are here let's check Risk Index.
This is certainly muted with credit markets less nervous than they have been on two other occasions since 2008 though the chart did make a higher low - next higher high will be a new warning bell.
Tariff Tantrum - India
US took India off the preferred country list last week
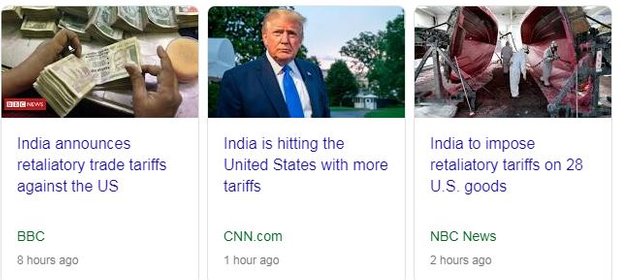
India announces retaliatory tariffs on the weekend mostly targeting US agriculture. The tariffs are huge. This could be an ugly war as US is a massive importer of Indian software talent - ship em all home will be a Trump tactic, just like he is doing to Chinese students.
Afterpay - Austrac
Afterpay (APT.AX) falls foul of money laundering regulator, Austrac
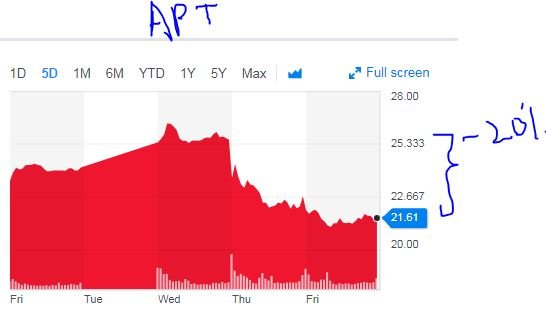
Afterpay is ordered by a court to appoint external auditors to verify their money laundering procedures with the regulator, Austrac, refusing to accept internal audit activity. This is a tough situation for the company as they do not have the resources to cover possible fines. Austrac settled with Commonwealth Bank (CBA.AX) for A$700 million for deposit ATM related breaches. CBA can afford that.
That 20% drop knocks this stock out of the 56 Percent Club.
Bought
Yamana Gold Inc. (AUY): Gold Mining. Added January 2021 2/3 bull call spread to one portfolio with net premium of $0.27 offering maximum profit potential of 270% if price moves 48% from Friday's close of $2.04. 5 contracts is around what dinner out for two would cost.
Bull call spread [Means: Bought strike 2 call options and sold strike 3 call options with the same expiry]
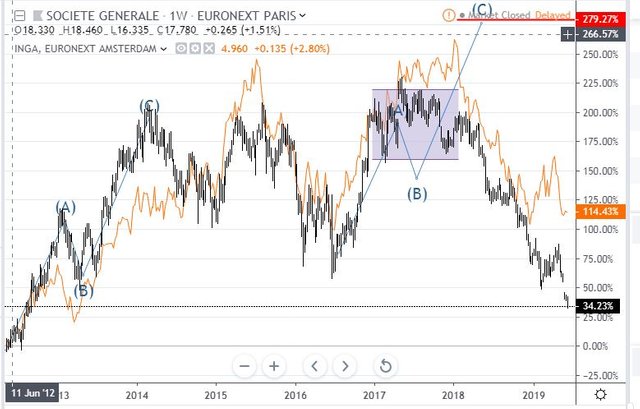
Société Générale S.A (GLE.PA): French Bank. Dividend reinvestment. Reinvestments are supposed to be done without taking off withholding tax. This is a way to avoid French taxes which are over 30% and pay Australian tax (no worse than 15% in a pension fund). I checked the calcs - withholding tax was taken off and then the French government levies a transaction tax too. No wonder "Europe Muddles" is a problem - the place is run by the French (and the Germans) who love to tax stuff
Quick look at the chart - price is in free fall. I was probably better off taking the money and running. This is going to be ride for the long haul. Alternate idea would be to invest in a better European bank - ING Groep (INGA.AS - orange line) - doing 80% better since the debt crisis of 2012.
Sold
JP Morgan Chase (JPM): US Bank. Jim Cramer was selling a portion in Actions Plus Portfolio into strength to raise a war chest. While my percentage holding is less than his remainder I chose to do the same. 6% profit since January 2019.
Shorts
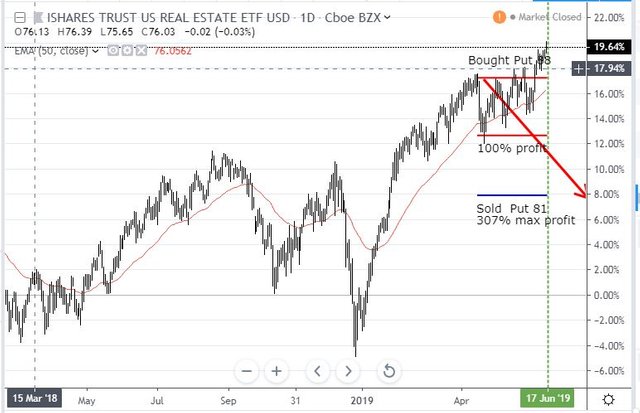
iShares U.S. Real Estate ETF (IYR): US Real Estate. Closed out June expiring 88 strike put option which is part of a 88/81 bear put spread. Took an 80% net loss since April 2019. Too bad I did not notice this holding was sitting in two portfolios when I closed it out the day before in another.
I did look at a new trade trading this back to the moving average. It feels like price just wants to keep surging while investors search for yield. I held off
Naked Puts
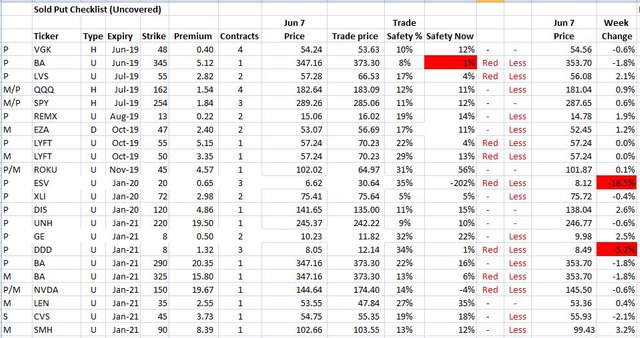
Weekly update on status of uncovered put contracts. The table shows in expiry order the uncovered puts [income trade puts are not here]. Key columns are strike, latest price in the centre and the safety percentages. I have highlighted in RED trades that are within 35% of safety.
- Biggest faller of the week is Ensco plc (ESV) sliding with oil prices. The exposure is small but there is currently a $4000 loss lurking there.
- Boeing (BA) is getting close to the wire again - I check this price every day when markets open. The later expiries are less concerning
- Other big faller was 3D Systems (DDD) - it is above water but only just.
- Nvidia (NVDA) remains negative but I am sure this will sort itself out before expiry in 19 months time.
Cryptocurency
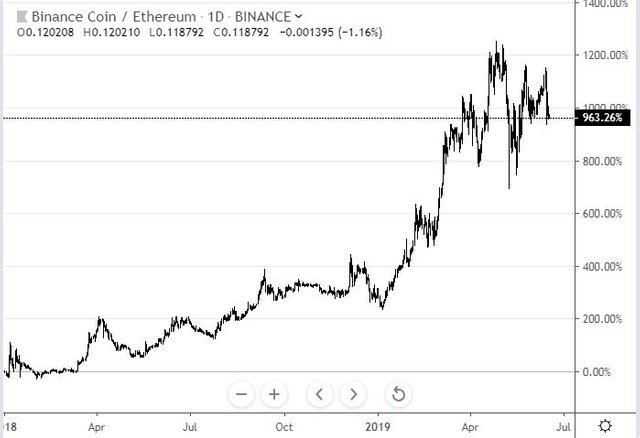
Binance Coin (BNBETH): With Binance closing down access to US customers, Binance Coin, which is used to pay trading costs, has taken a small hit (down 8% after the news broke). I recomputed the amount of Binance Coin I need to cover trading costs and reduced my holdings in two portfolios. Nice to see 623% profit since January and February 2018. I must say I had not been paying attention to the rise and had to check the calcs again.
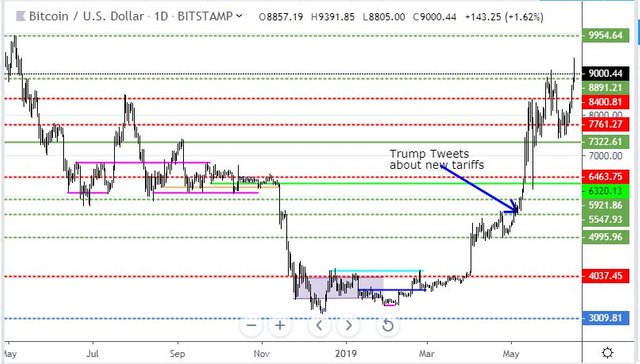
Bitcoin (BTCUSD): Price range for the weekend was $1217 (15% of the low). Price raced ahead for 3 consecutive days without drawing breath to make a higher high. Next level up is at $9954 not seen since May 2018. There is a possible level at $9755. These old levels have not really been respected though I do know I have take profit targets sitting on most of them from the last cycle down.
Was a busy weekend with 4 trades hitting profit targets for $517.67 (5.9%) and $597.58 (6.8%) and $315.24 (3.7%) and $616.17 (7.7%) per contract profit. Trade duration ranged from 13 months to 3 weeks to 10 days.
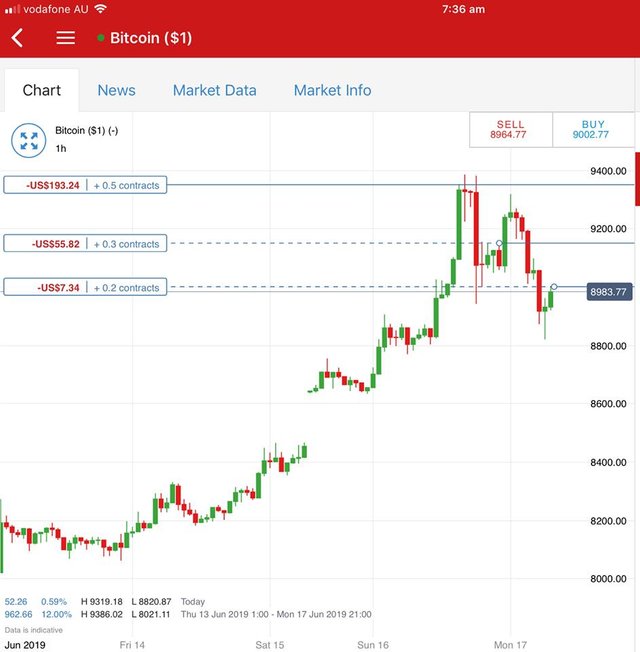
I replaced 2 of those trades using reversals on a 1 hour chart (the blue dots).
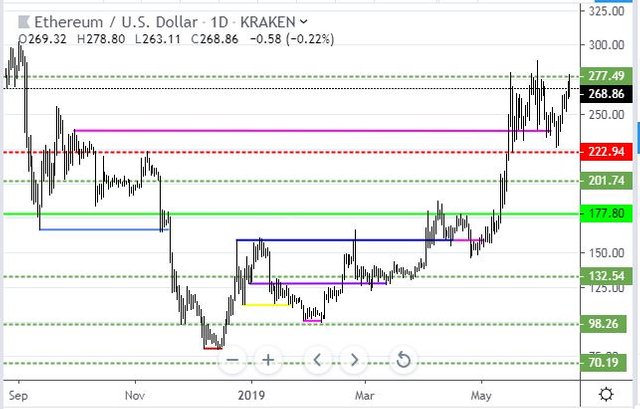
Ethereum (ETHUSD): Price range for the weekend was $26 (10% of the low). This chart looks somewhat like the Bitcoin chart with price racing to test the highs at $277. This is not blue sky like the Bticoin chart as price has been here a few times in the last month. Do not be surprised to see the sellers emerge and take price back to a quieter spot before having a go at clearing $277 fully.
Was a busy weekend with 2 trades hitting profit targets for $9.06 (3.4%) and $24.00 (9.7%) per contract profit. Trade duration was shorter at 12 and 13 days.
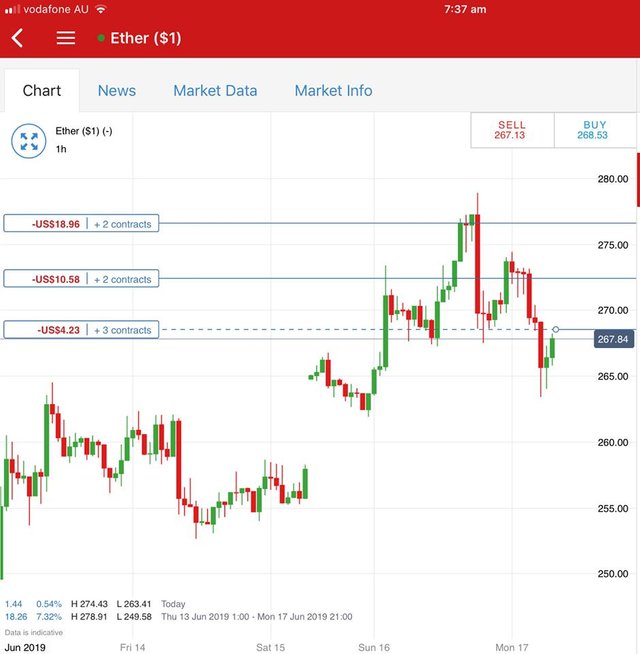
I replaced 1 of those trades using reversal on a 1 hour chart (the blue dot).
Ripple (XRPUSD): Ripple took longer to move pricewise BUT there were stories circulating that the Facebook coin could be based on Ripple - that brings speculative buyers. One trade closed for $0.0152 (3.8%) per contract profit. Note: these Ripple trades are hedging against a Bitcoin dump rumour = not happening yet.
CryptoBots
Profit Trailer Bot One closed trade (1.35% profit) bringing the position on the account to 8.81% profit (was 8.80%) (not accounting for open trades).
PT Defender continues defending 12 coins.
New Trading Bot Trading out using Crypto Prophecy. No closed trades
Currency Trades
Outsourced MAM account Actions to Wealth closed out 3 trades on AUDUSD, EURUSD, GBPUSD for 0.14% profits for the day. It paid to be long USD with one short USD trade losing. Trades open on EURGBP, EURUSD, AUDCAD (0.16% negative)
Cautions: This is not financial advice. You need to consider your own financial position and take your own advice before you follow any of my ideas
Images: I own the rights to use and edit the Buy Sell image. News headlines come from Google Search. Economy charts from St Louis Federal Reserve. All other images are created using my various trading and charting platforms. They are all my own work
Tickers: I monitor my portfolios using Yahoo Finance. The ticker symbols used are Yahoo Finance tickers
Charts: http://mymark.mx/TradingView - this is a free charting package. I have a Pro subscription to get access to real time forex prices
Bitcoin: Get started with mining Bitcoin for as little as $25 http://mymark.mx/Galaxy
Tracking: Keeping track of your crypto trades is a whole lot easier with CoinTracking.info. Get 10% off all your account upgrades https://mymark.mx/CoinTracking
June 14-16, 2019



Hi, @carrinm!
You just got a 0.41% upvote from SteemPlus!
To get higher upvotes, earn more SteemPlus Points (SPP). On your Steemit wallet, check your SPP balance and click on "How to earn SPP?" to find out all the ways to earn.
If you're not using SteemPlus yet, please check our last posts in here to see the many ways in which SteemPlus can improve your Steem experience on Steemit and Busy.
Downvoting a post can decrease pending rewards and make it less visible. Common reasons:
Submit