Markets do a little sideways with technology up. Profits taken in European insurance and Japan and Gulf make their way to silver and social media and food services. Some short trades in semiconductors and footwear and software.

Portfolio News
Market Rally
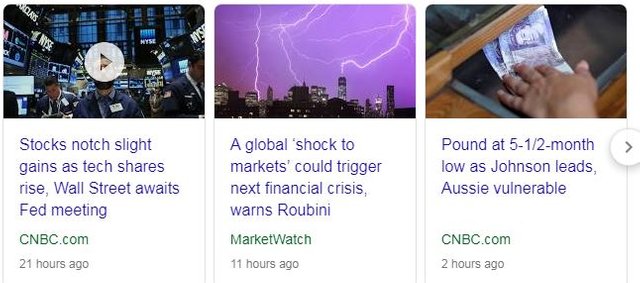
US markets were mixed ahead of the Federal Reserve meeting
Technology stocks did shrug off the Friday blues a bit. They do not seem too fussed about Huawei and Broadcom. Boeing (BA) chose not to do 737 Max 8 test flights this week during Paris Air Show - maybe next week. That was enough to give price a bit of support away from that $345 level I am watching. I did have to read the "global shock" article - mindless twaddle from the "media’s favorite permabear". That is what normally drives recession in a joined up world. Make up your own mind.
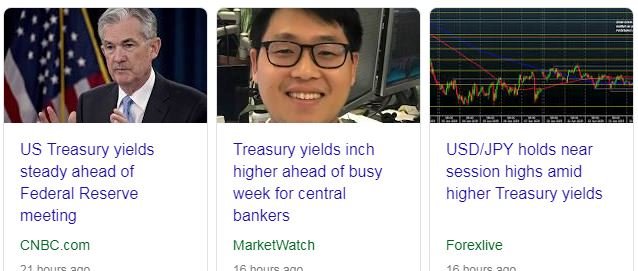
Yields were quiet too.
Britain Bumbles
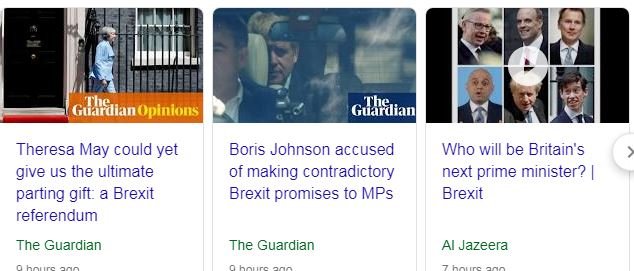
Weekend was first round of voting for new leader of Conservative Party - Boris is ahead
Markets do not like any of the prospects with the Pound taking a smashing. It has become a self-serving shambles - read this article and make up your own mind. I do know that my holiday to UK next month is getting cheaper by the day. Be aware that The Guardian is somewhat left leaning.
https://www.theguardian.com/commentisfree/2019/jun/17/theresa-may-brexit-referendum
Bought
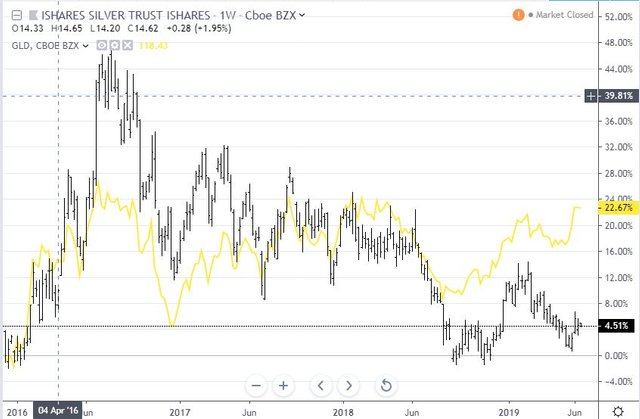
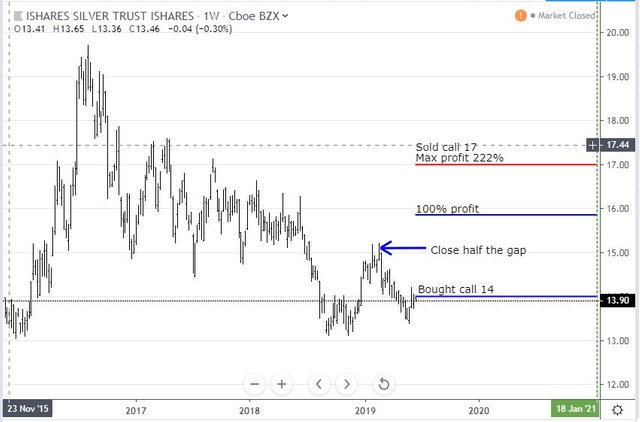
iShares Silver Trust (SLV): Silver. CNBC Options Action team reviewed their gold idea from a few weeks back. Stick with it was the message. They did however highlight the way Silver has been lagging gold and expect it to explode once the gap starts to close. Here is the gap chart from the 2016 lows.
Silver (black bars) has lagged iShares Gold Trust (GLD - yellow line) by 18 percentage points from the 2016 lows. In my pension portfolio I bought the stock so that I can later add a bull call spread. Close half the gap and price will make a 9% return (marked with blue arrow on next chart). I did add a January 2021 14/17 bull call spread to two portfolios for a $0.93 net premium offering a maximum profit potential of 222% for a 22% rise from closing price of $13.90. Let's look at the chart which shows the bought call (14) and 100% profit as blue rays and the sold call (17) as a red ray with the expiry date the dotted green line on the right margin
Close half the gap is around the previous highs. 100% profit is in the middle of the early 2018 trading range and maximum profit is only half way to 2016 highs. That is why I bought stock only in one portfolio to keep some open ended upside. This is a hedging trade. Interest rate markets are very different now to what they were in 2016 and 2018 (rates falling vs rising). I was not alone on the 14 strike but I was on the 17's.
Compass Group PLC (CPG.L): Europe Food Services. Averaged down entry price in the portfolio that pays in British Pounds. Got to say I do not like transaction taxes. This one was the cost of a dinner out for one in London.
Facebook, Inc (FB): Social Media. Before market open Jim Cramer talked about the launch of the Facebook crypto coin, LIBRA. He pointed to the price chart and says "you see that high there. This launch will take that high out" This is a big deal as he has been something of a crypto skeptic. I bought a small parcel of shares in the pre-market and collected the 4.24% rise in the regular market for free.
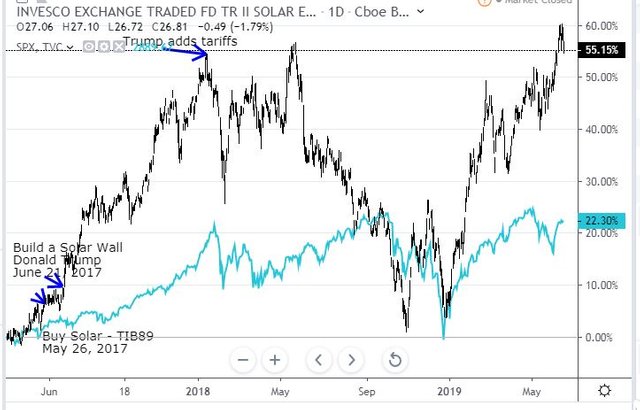
Sunrun Inc (RUN): US Solar Power. Solar sector has outperformed the S&P 500 year to date by more than double. The chart below compares the Invesco Solar ETF (TAN - black bars) to S&P 500 (blue line).
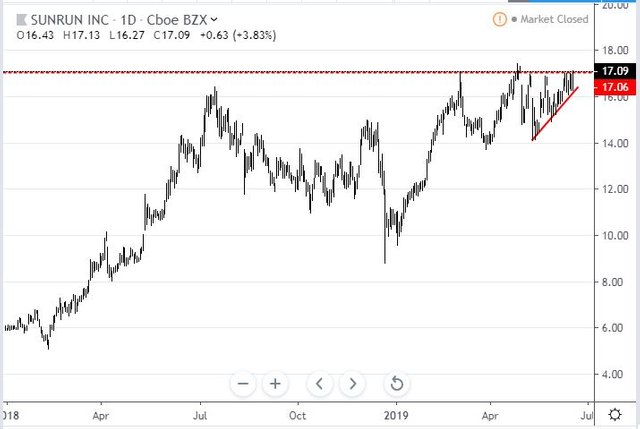
I have been invested in solar on and off since the 2017 lows. The introduction of tariffs in early 2018 changed the dynamics of the industry and my remaining investment in Sunpower (SPWR) has ridden out the lows and delivered a steady flow of covered call income. When the Real Vision trade idea came up I paid attention. They looked into the components of the TAN ETF and identified a stock that had reached up to a level which it was not able to break for an extended period. The idea is that it will push up hard if and when it breaks through. California is mandating renewables solidly - that will help here. I added a small parcel to one portfolio. Here is the chart which runs from when the solar tariffs were announced in January 2018. Of note: this business was not affected by the tariffs (introduced at left margin) - they have clearly been able to pass the increases on to their customers.
This is a trade waiting for the break up through that resistance level. Of importance is the series of higher lows compressing into that triangle
Sold
Allianz SE (ALV.DE): Europe Insurance. Had set a profit target at 52 week high some time ago. That was hit for 48% profit since April 2016. European insurance has been a strong sector in a soft market. I am holding options contracts in this portfolio - one in-the-money and one out-the-money. I do have other Europe insurance holdings.
Wisdom Tree Middle East Dividend ETF (GULF): Middle East Index. Feeling somewhat disturbed by the events in the Straits of Hormuz. This sort of stuff is not good for local Gulf markets. Time to take the exits with partial fill for 8% profit since May 2018.
Zurich Insurance Group AG (ZURN.SW): Swiss Insurance. Price has been holding above SFr320 for some time but not looking like it wants to reach up to SFr 350, the next strike. Closed out January 2021 strike 320 call options for 70% blended profit since January 2017. Steadily reducing my investment in Zurich Insurance as my wife is now working there following a takeover of the business she was in.
Comstage Nikkei 225 ETF (CBNKY.SW): Japan Index. Taking profits on half my holdings now that profit has passed 100%. Partial fill for 101% profit since July 2011.
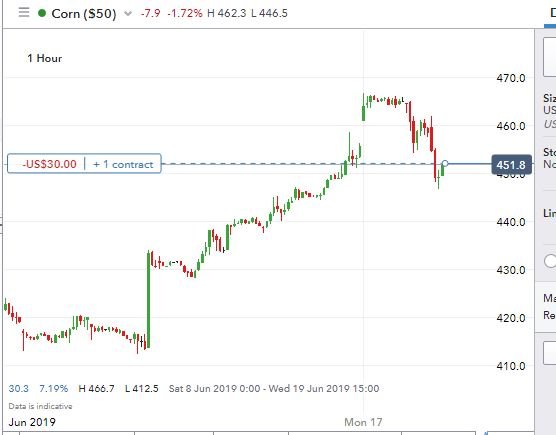
Corn Futures (CORN): Price started to retreat after making a new high. I had trailed stop loss up to $455 - chose to close out the remaining contract before the stop for $23.70 (5.5%) per contract profit.
I replaced that trade this morning on a 1 hour reversal and below my last exit.
Shorts
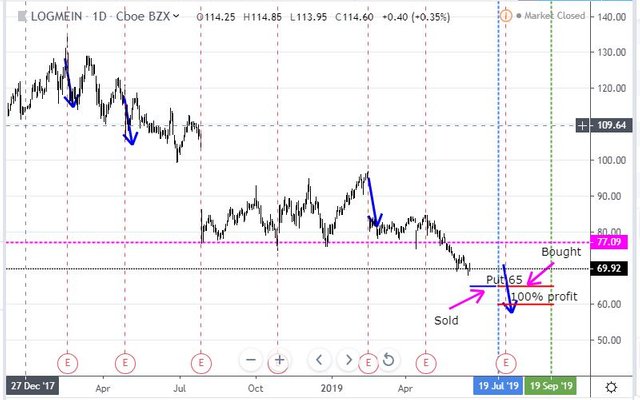
LogMeIn, Inc (LOGM): US Software. Real Vision idea as part of a long:short trade paired with Advanced Micro Devices (AMD). I am already long AMD. Shorted the stock and bought a July/September strike 65 calendar put spread for net premium of $2.50 (3.8% of strike). The chart shows the sold put as a blue ray expiring on blue dotted line and the bought put as a red ray expiring on green dotted line. Earnings dates are shown (red E)
The chart shows how price has collapsed through that resistance level at $77.09 (that is where the buy stop is on the stock trade). I have modelled price moves after earnings (4 drops out of last 6 earnings) and positioned that over the next earnings date - 38 days away (blue arrow). What the trade structure is looking for is price to consolidate in the current zone until July expiry and fall with earnings after that. That will take the trade comfortably to 100%. The Real Vision target is for price to drop as far as $40.
[Means: Calendar Put Spread. Sell close dated put and buy long dated put at same strike. The premium on the short put funds the long put premium]
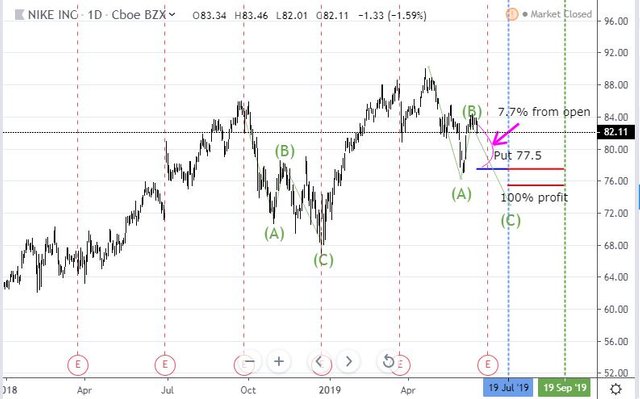
NIKE, Inc. (NKE): Footwear. CNBC Options Action team reviewed Nike performance coming into upcoming earnings. The price range of moves into earnings has been minus 5.7% to plus 1.9%. With a high price earnings multiple, they will not be surprised to see a minus number. Trade structure is similar to LogMein with a July/September strike 77.5 calendar put spread. Net premium of $1.02 (1.3% of strike). The chart shows the sold put as a blue ray expiring on blue dotted line and the bought put as a red ray expiring on green dotted line. Earnings dates are shown (red E)
The chart certainly looks toppy with head and shoulders formed. Trade price is currently above the minus 5.7% average move into earnings (chart shows 7.7% from Monday opening price). Trade structure is for price not to drop more than 5.7% into earnings and then drop more after that. I have modelled an ABC correction wave from the October highs and cloned that across to the recent highs. A repeat of that and the trade will make 100% profit though it does risk being below $77.50 before expiry of the sold put (the dotted blue line). Delta profits on the September expiry put should cover the risk of that.
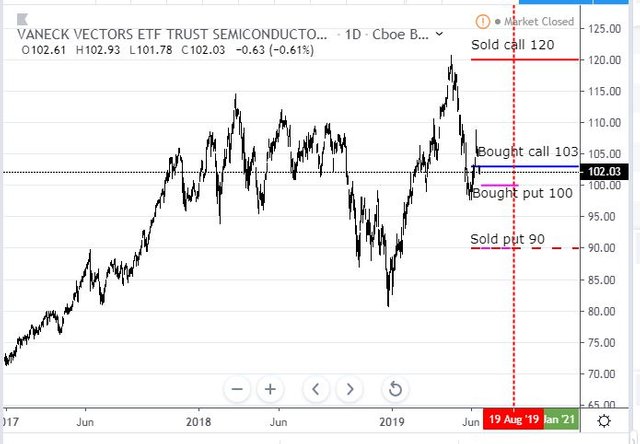
VanEck Vectors Semiconductor ETF (SMH): US Semiconductors. CNBC Options Action team reviewed semiconductor performance relative to S&P 500 = underperforming. Their expectations are the fallout from Huawei is worse that people are expecting and will play into the next earnings season strongly. I am holding a call spread risk reversal with a 2021 expiry. I chose to leave that in place rather than take the small profit to date - my instinct is 19 months is long enough to see how a trade deal works through. I did however follow their trade idea and added an August 2019 100/90 bear put spread with a net premium of $2.48 offering maximum profit potential of 303% if price drops 13% from $102.03 closing price. Quick update of the chart which shows the new trade as pink rays (the sold put overlaps with the one on the existing trade)
The concern was that the break above the trading range feels like a false break and price could well correct below the bottom of that prior range (i.e., towards $90) and that upcoming earnings will be the catalyst if the Broadcom news was anything to go by. Longer term I would not be surprised to see a consolidation and a break higher if the China trade deal is resolved in the next 6 to 9 months. That is why I left the other trade on. I could close it now at a profit.
Expiring Options
The Boeing Company (BA): US Aircraft Manufacture. Grabbed back some premium on the June expiring 380/420/345 call spread risk reversal I am holding. Price is not going to reach up to $380 by Friday though it does look like it will stay above the 345 sold put level closing at $354.90 today. Will report whole profit/loss story at expiry
Electronic Arts Inc (EA): Video Gaming. Closed out bought leg of strike 100 calendar call spread for a net loss of 87% of net premium paid for the spread. Price just did not want to push back over 100. The sold leg had already expired in my favour.
Cryptocurency
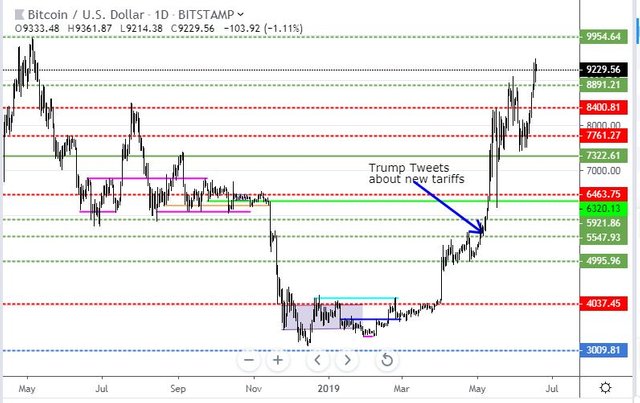
Bitcoin (BTCUSD): Price range for the day was $504 (5.6% of the low). Price just keeps marching higher making a new higher high on this cycle.
Two profit targets reached for $199.63 (2.2%) and $312.61 (3.5%) per contract profit. Both these contracts are from the last few days trades
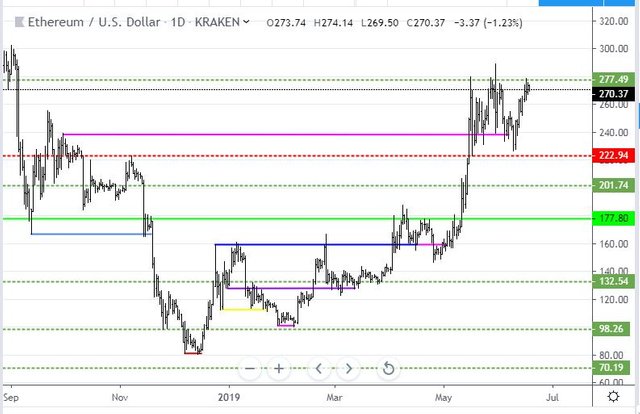
Ethereum (ETHUSD): Price range for the day was $8 (3% of the high). Price makes an inside bar below the resistance at $277. I did write in TIB436 - maybe I was right
Do not be surprised to see the sellers emerge and take price back to a quieter spot before having a go at clearing $277 fully.
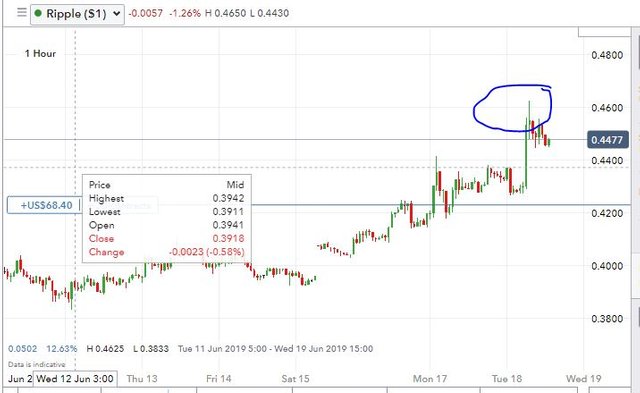
Ripple (XRPUSD): Ripple caught onto the price moves from Bitcoin and took out two profit targets for $0.0475 (11.5%) and $0.0277 (6.9%) per contract profit. Trade duration of 2 days. Chart shows the price surge past my take profit level at 0.46(ringed). I remained exposed in one trade (shown on left) and I am looking for reversals
CryptoBots
Profit Trailer Bot No closed trades
New Trading Bot Trading out using Crypto Prophecy. No closed trades
Currency Trades
Outsourced MAM account Actions to Wealth closed out 4 trades on AUDCAD, AUDNZD and AUDUSD for 0.52% profits for the day. Being short AUD and NZD was the way to win. Trades open on EURGBP, EURUSD and USDCHF (0.98% negative). Being long GBP is not a good place to be.
Cautions: This is not financial advice. You need to consider your own financial position and take your own advice before you follow any of my ideas
Images: I own the rights to use and edit the Buy Sell image. News headlines come from Google Search. All other images are created using my various trading and charting platforms. They are all my own work
Tickers: I monitor my portfolios using Yahoo Finance. The ticker symbols used are Yahoo Finance tickers
Charts: http://mymark.mx/TradingView - this is a free charting package. I have a Pro subscription to get access to real time forex prices
Bitcoin: Get started with mining Bitcoin for as little as $25 http://mymark.mx/Galaxy
June 17, 2019


Hi, @carrinm!
You just got a 0.42% upvote from SteemPlus!
To get higher upvotes, earn more SteemPlus Points (SPP). On your Steemit wallet, check your SPP balance and click on "How to earn SPP?" to find out all the ways to earn.
If you're not using SteemPlus yet, please check our last posts in here to see the many ways in which SteemPlus can improve your Steem experience on Steemit and Busy.
Downvoting a post can decrease pending rewards and make it less visible. Common reasons:
Submit