Markets edge higher as Gulf tensions drive oil and gold. Options expiry brings lots of exits and great timing for a cash build especially in the pension portfolio. Rains in the plains adds more scope in agriculture commodities. Bitcoin makes new 2019 highs and recalls the glory days of 2017

Portfolio News
Market Rally
US markets took a breather on Friday after a big up and down weak and did more sideways than upwards.
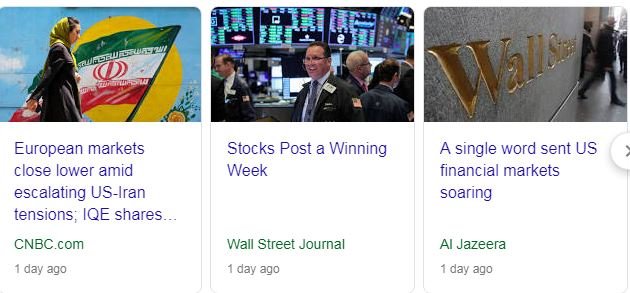
There was relief when there was no retaliation for the drone attack though oil prices did move up some more (11% for the week).
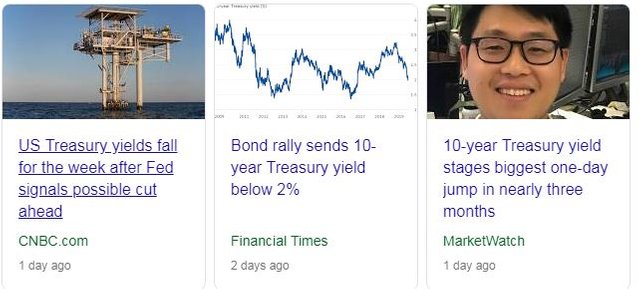
Yields also have an up and down day with the headline writers looking at different durations to pick their preferred headline - some up and some down.
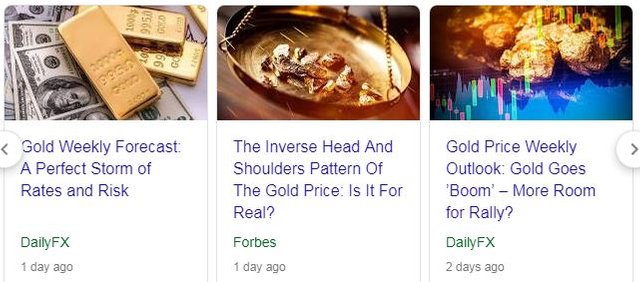
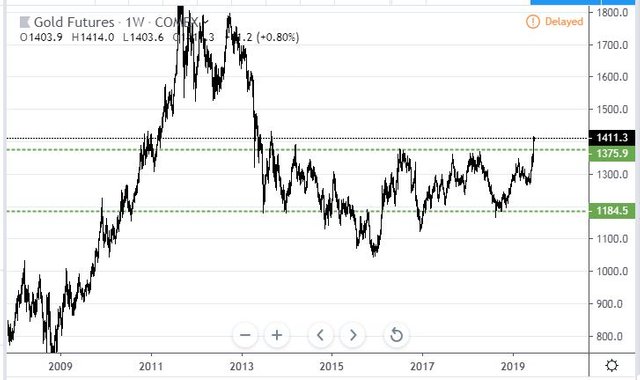
Biggest mover in main markets is gold topping $1,400 for the first time since September 2013. The chart shows a classic example of how price breaks after a compression zone.
Crypto Craze
The big moves come from Bitcoin and Ethereum
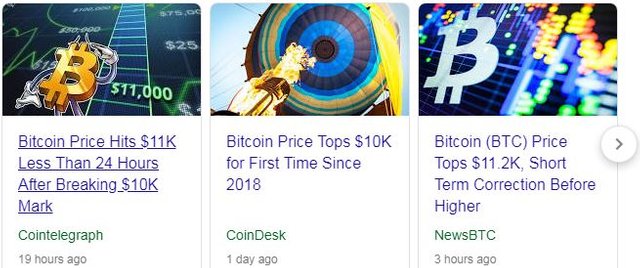
All the FOMO lovers are tweeting and writing about the next breakthrough price - e.g., how quick the run from $10,000 to $11,000 was this time compared to 2017. All good for me as my trading strategy is to trade long on reversals when prices are rising. My comfort in the reversal strategy has not got to the level of considering trading short.
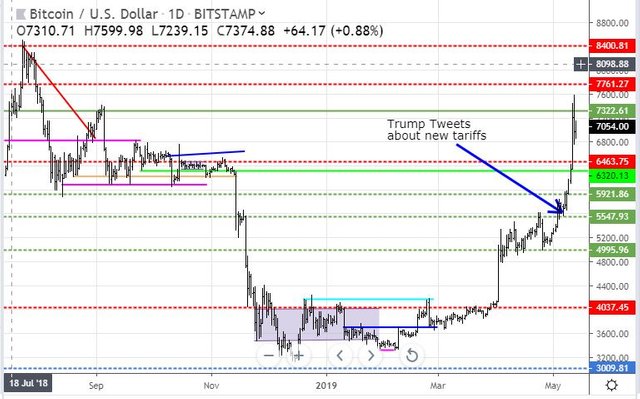
Now there is also a lot of speculation about the drivers. I wrote a few weeks ago about China capital flows in TIB416
Chinese investors flock to Bitcoin
Here is a chart from then when I first labelled the Bitcoin chart for this run. That was the trigger for the first wave.
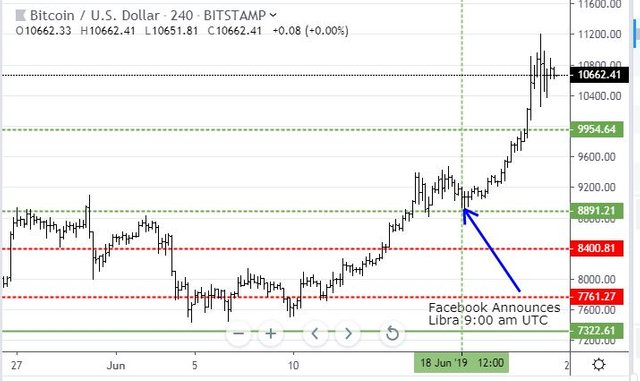
I am going to guess that the trigger for the second wave is Facebook Libra - the timing on the chart is not coincidental = within a few hours of the press release announcement. Note: A 4 hour chart.
Bought
Corn Futures (CORN): One contract closed on trailing stop loss for $6.60 (1.48%) per contract profit. Replaced with a new contract on a 1 hour reversal
Wheat Futures (WEAT): I watched the corn price keep moving ahead and figured that what might be driving corn could also be driving wheat. Chart showed that wheat price had made a reversal which corn had not done - added one new continuous futures contract in my IG Markets account. This is a new avenue for investing for me.
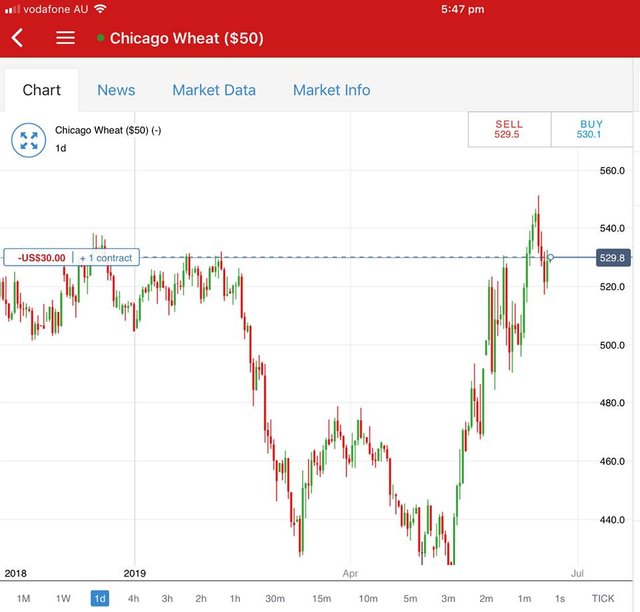
I did see a headline today on Bloomberg TV saying that soya beans could be the next to move like corn - my pending order is waiting for market to open.
Sold
Sales coming all from assignment of covered calls - 10 in all
Square, Inc. (SQ): US Payments Provider. Assigned on covered call. 1.8% blended profits since May 2019. Cumulative income added an additional 1.5%. I will buy into this stock again as it is a disrupter.
eBay Inc (EBAY): Online Commerce. Assigned on covered call. 18% blended profits since October 2018/February 2019. Cumulative income added an additional 2.9%.
Cypress Semiconductor Corp (CY): US Semiconductors. Assigned on covered call. 3.4% blended profits since March/July/August 2018. Cumulative income added an additional 4.3%. The one that got away with Infineon paying a huge premium to take over. I do still hold a small parcel less than 100 shares.
Petróleo Brasileiro S.A. (PBR): Brazil Oil Producer. Assigned on covered call. 37% blended profits since June/July 2018. Cumulative income added an additional 6.0%. Nice to see price moving up steadily as Brazil fixes its problems despite a falling oil price in prior weeks.
Van Eck Vectors Russia ETF (RSX). Assigned on covered call. 19% profits since June 2017. Cumulative income added an additional 0.9%.
Van Eck Vectors Steel ETF (SLX). Assigned on covered call. 14% blended loss since August 2018/April 2019. Cumulative income dragged back 1.7%. I did not put enough leeway on this covered call trade. So much for tariffs helping US steel producers.
Sunpower (SPWR): Solar Power. Assigned on covered call. 16% blended profit since May/December 2017/March 2019. Cumulative income added an additional 6.5% (plus a little). I did add SunRun (RUN) to this portfolio earlier in the week to replace Sunpower.
Uber Technologies, Inc (UBER): Ride Sharing. Assigned on covered call. 3% profit since May 2019. Cumulative income added an additional 5.6%. Trade idea from CNBC Options Action team - buy stock to write covered calls. Have replaced the stock and written for July expiry already.
Viacom Inc (VIAB): US Media. Assigned on covered call. 0.9% profit since April 2019. Cumulative income added an additional 0.9%. Closing price at $30.80 was just above the sold strike (30.5). With the CBS merger possibility lurking but not fully priced in this looks like a good stock to replace.
Expiring Options
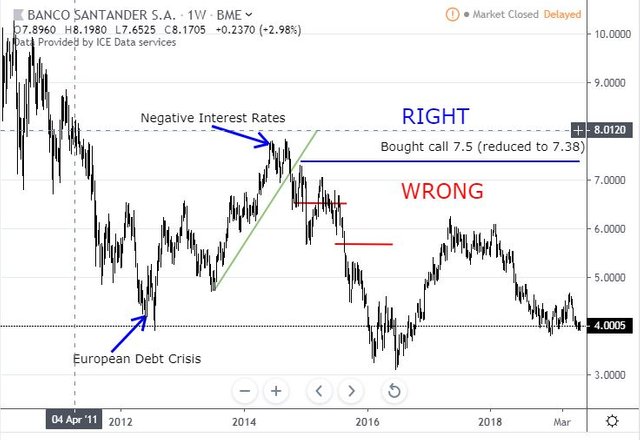
Banco Santander, S.A. (SAN.MC): Spanish Bank. Strike 7.38 call options expired - bought December 2014 and January 2015. It pays to look at sad trades and learn lessons. This is a great example. Trade idea from my prior investing coach expecting the trend from the European Debt Crisis lows to continue - i.e., price to shake off the lower low and keep following the uptrend. What we missed was the impact negative interest rates would have on bank profitability - the trade was WRONG every inch of the way.
Now there is also a trade management failure. When price broke lower and made another lower low (left hand red ray) was a time to exit and again when the price broke below the right hand red ray. My coach was always keen to keep holding especially when there was 3 or 4 years to go to expiry
While I was researching the negative interest rates story I came across this recent article. Why is it that Europeans are not rioting on the streets (yellow vests in France aside) given 10 years of lacklustre growth? The answer lies in the impact of negative interest rates flowing to cheap mortgages to a surge in property prices = happy homeowner consumers.
That, Vistesen says, is why bad economic news – recession in Italy, a collapse in Germany’s manufacturing sector -never seems to faze happy European consumers.
https://www.businessinsider.com.au/negative-interest-rates-europe-property-prices-2019-5
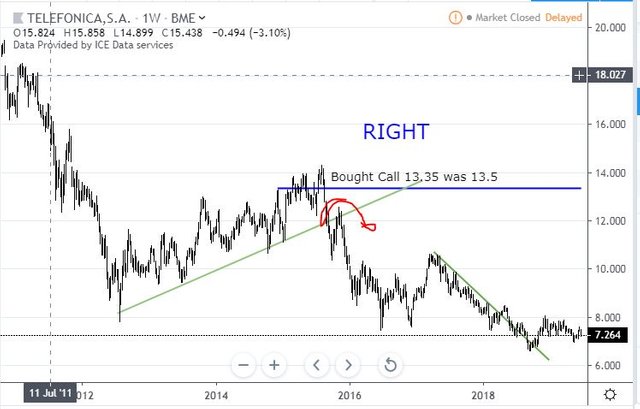
Telefónica, S.A. (TEF.MC): Spanish Telecom. Strike 13.35 call options expired - bought December 2014 and March 2015. Another lesson in trade management.
March 2015 entry looks a bit like a momentum trade following the uptrend. The trade management failing here was the break of the uptrend and the retest of the underside of the trend line = as solid a reversal signal as any BUT there were more than 3 and half years to go.
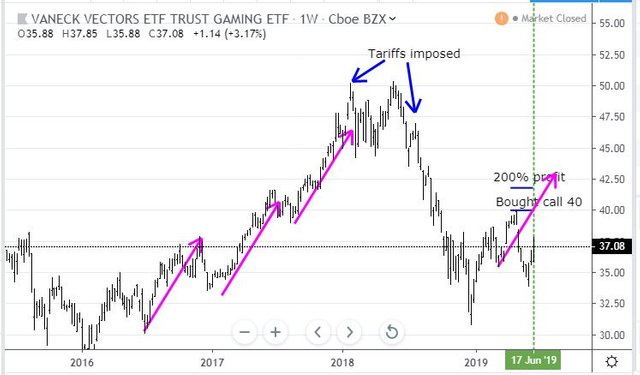
VanEck Vectors Gaming ETF (BJK): Gaming. Strike 40 call options expired - closing price $37.08. Price never passed bought strike since April. Quick update on the chart shows that price was moving along the pink arrow price scenario and then stalled.
Looking at the way price bounced off a higher low could suggest the start of a new run = possibly the trade ran out of time. See TIB400 for the original trade discussion.
Las Vegas Sands Corp. (LVS): Gaming. Strike 67.5 call options expired - closing prices $59.23. I did write up a report in TIB433 given the adjustments I made to this trade.
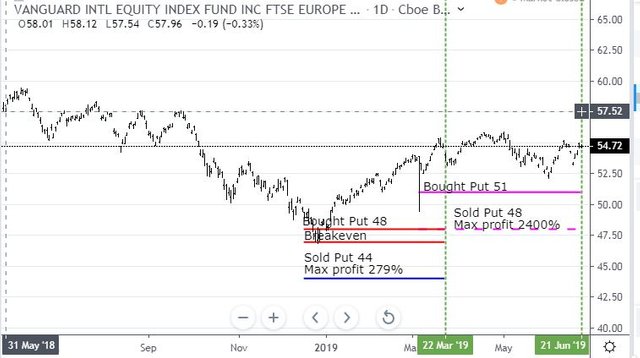
Vanguard FTSE Europe Index Fund ETF Shares (VGK): Europe Index. 51/48 ratio put spread expired - closing price $54.72. This was a hedging ratio put spread with the 2:1 ratio providing only 85% coverage - i.e., trade lost 15%. Quick update of the chart shows that price stayed above the bought put strike (51) all the time - i.e, it never dropped more than 5% from the starting level.
Chart also shows the price I paid of not putting the full ratio spread on at the start - the dotted pink ray starts later than the solid pink ray. The $55 cost for the trade is cheap insurance for 8% coverage of European holdings. I will explore setting up the trade below the trading range, say 52, rather than the 5% - 10% I did last time and next month will have more coverage.
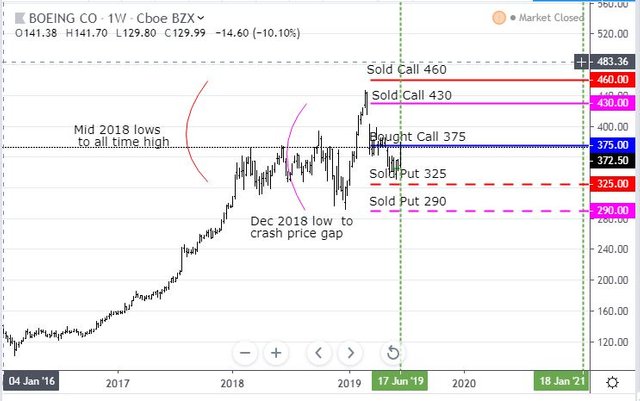
The Boeing Company (BA): Aircraft Manufacture. Remaining legs of June call spread risk reversal expired for a net loss of $250. Winning legs were the 355 sold put and the rolled down leg 345 strike put option and the sold 420 strike call option. I did close out the bought strike 380 call option before expiry. If I had waited a day or two I could have clawed some more premium back BUT price was never going to cross $380 in the last weeks (closing at $372.50). The key lesson in the trade is that June was too soon for Boeing to fix the problems. I did write in TIB381 - I got that wrong
Riskiest trade is the short term trade if Boeing does not make meaningful progress within 3 months. They have been aiming for May delivery of software changes following Lion Air crash anyway. I expect they will deliver.
Quick update on the charts as I do have longer dated trades open.
Price has stayed comfortably above the levels of the sold puts (325 and 290). Price did spend some time above the bought call strike in the first few weeks (375) and has got close again in the last week (buoyed by Paris Air Show order flow). The most encouraging part of the chart is price did make a higher low from the December selloff lows which is above the 325 sold put level.
Income Trades
Successful month covered call writing with only 10 out of 40 trades being assigned, one bought back and 1.34% average premium.
Reminder that the strategy is to write calls on stocks I am happy to exit = a way for the market to find exit points. In a few cases I will buy the stock back and go again.
Randstad N.V (RAND.AS): Europe Human Resources. Price was hovering around the sold strike (50). Bought back the covered call reducing sold premium from 1.09% to 0.89% (including trading costs)
Naked Puts on Cisco (CSCO), Honeywell (HON) and McDonalds (MCD) all expired worthless making 100% success rate on naked put income trades.
Cryptocurency
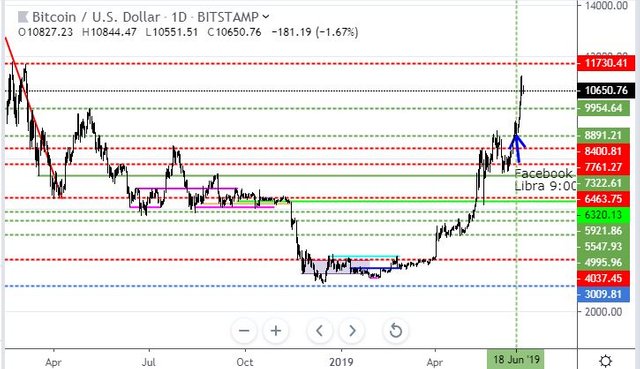
Bitcoin (BTCUSD): Price range for the weekend was $1713 (18% of the high). Price just keeps rolling and ignoring resistance levels and making new highs on each day through the weekend. Next level up is $11,730 (top red dotted line newly drawn in) and this comes from two day touches on one of the few recovery bounces on the way down in February and March 2018.
Busy weekend with 4 contracts hitting price targets for per contract profits of $475.59 (4.44%), $372.66 (3.52%), $772.23 (7.77%), $321.23 (3.44%). Trade durations 1 day, 17 months, 15 months, 13 months.
Two new contracts opened on reversals. Currently long 1.8 BTC (was as high as 3.5 BTC)
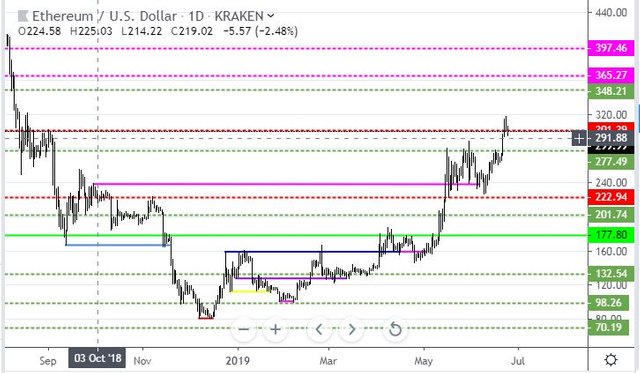
Ethereum (ETHUSD): Price range for the weekend was $37 (14% of the low). Price races through resistance at $277 and tests up to top $300 for the first time since August 2018 and takes a pause with price today dropping below prior day low (unlike Bitcoin). The $300 level could be important as it was respected in August/September 2018 a few times (top dotted red line - newly drawn)
Busy weekend with 4 contracts hitting price targets for per contract profits of $32.39 (11.71%), $15.59 (5.72%), $9.46 (3.52%), $9.78 (3.65%). Trade durations a few days to longest of 10 months
One new contract opened on reversal. Currently long 43 ETH
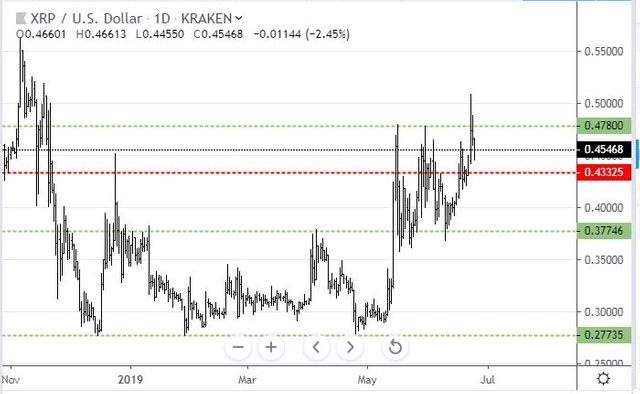
Ripple (XRPUSD): Price range for the weekend was $0.07805 (18% of the low). Price races through the resistance level I drew in a few days ago (top green line) to make a new high before Bitcoin or Ethereum did and then pulls back to settle below the previous high. My guess that the new high would be a lower high is blown out of the water with that move BUT price is pretty well where I guessed it would be (below 0.46)
Busy weekend with 2 contracts hitting price targets for per contract profits of $0.023 (5.11%), $0.019 (4.31%). Trades open 5 days.
Two new contracts opened on reversals. Currently long 60 XRP contracts (100 per contract)
CryptoBots
Profit Trailer Bot No closed trades (1.65% profit). I did open up trading for 1 more pair to try to unblock the account. Altcoin prices do lag when there is a strong run in Ethereum (all pairs are vs ETH)
PT Defender continues defending 11 coins.
New Trading Bot Trading out using Crypto Prophecy. No closed trades
Currency Trades
Outsourced MAM account Actions to Wealth closed out 5 trades on AUDNZD, AUDUSD and GBPUSD for 0.35% profits for the day. Trades open on EURUSD and NZDUSD (0.50% positive)
Own Trading Closed out open trades on AUDCHF and EURJPY before London open on Friday for 0.49% profits. Short AUD and long JPY was the place to be.
Cautions: This is not financial advice. You need to consider your own financial position and take your own advice before you follow any of my ideas
Images: I own the rights to use and edit the Buy Sell image. News headlines come from Google Search. All other images are created using my various trading and charting platforms. They are all my own work
Tickers: I monitor my portfolios using Yahoo Finance. The ticker symbols used are Yahoo Finance tickers
Charts: http://mymark.mx/TradingView - this is a free charting package. I have a Pro subscription to get access to real time forex prices
Bitcoin: Get started with mining Bitcoin for as little as $25 http://mymark.mx/Galaxy. I will be topping up my mining contracts this week with a high Bitcoin price mining becomes affordable again.
June 21-23, 2019

Hi, @carrinm!
You just got a 0.42% upvote from SteemPlus!
To get higher upvotes, earn more SteemPlus Points (SPP). On your Steemit wallet, check your SPP balance and click on "How to earn SPP?" to find out all the ways to earn.
If you're not using SteemPlus yet, please check our last posts in here to see the many ways in which SteemPlus can improve your Steem experience on Steemit and Busy.
Downvoting a post can decrease pending rewards and make it less visible. Common reasons:
Submit