Markets cheer seeming progress on China talks. I go mining for silver deploying profits made in trading silver. Also continue taking the interest rate medicine in Europe.

Portfolio News
Market Flip Flop
Sea of green were the words I heard as US markets opened.
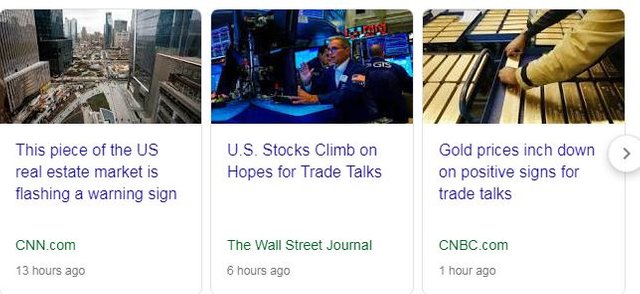
Maybe there were indeed phone calls over the weekend from China. It seems there were talks happening during the week too but nobody could say at what level. The market really is on an edge as the yield curve continues to flatten. The key for the upcoming holiday season is there needs to be real progress on China - otherwise the consumer will stop spending. Business investment is already flagging - just read the earnings announcements.
Earnings Moves
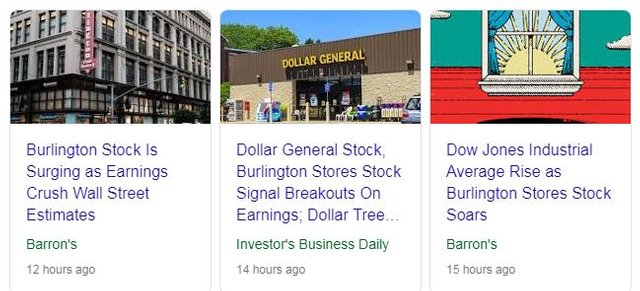
Burlington Stores, Inc (BURL) announced earnings and guidance that beat expectations and stock price pops 18%
This confirms that discount and off price retailing is a winning segment while main street retailers continue to struggle. Thanks to Jim Cramer Action Plus team for the idea.
Europe Stimulus
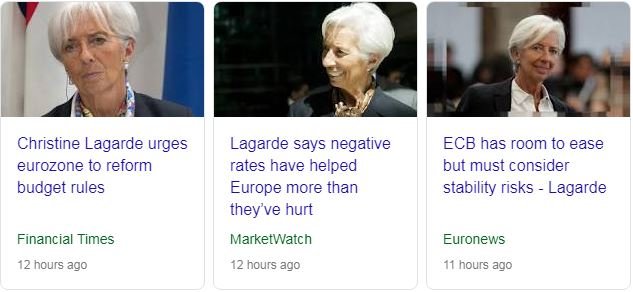
Christine Lagarde, currently head of the IMF who will take over from Mario Draghi at the European Central Bank (ECB) in November, talks about the prospects for European stimulus suggesting the ECB has plenty of ideas.
That got my ears pricked up. I had missed the news that she will replace Mario Draghi as head of the ECB. She really bothers me - she has been talking down growth data for quite a long time - even more cautious than Draghi.
Sold
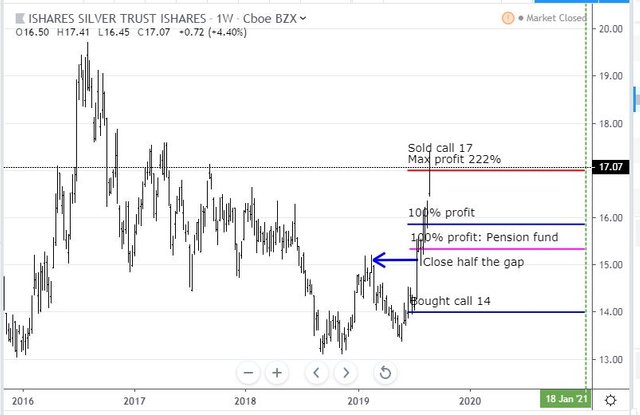
iShares Silver Trust (SLV): Silver. Price moved above the sold strike on a January 2021 14/17 bull call spread and held for a few days opening at $17.17. Closed out the 14/17 bull call spread for 250% profit since June 2019. The updated chart shows the way price has spiked and nice to see the profit percentage better than the trade set up calculation.
In another portfolio I closed an October 2019 strike 14.5 call option for 400% profit since June 2019. I replaced this trade with two silver mining contracts. I do have other options and stock trades open.
Bought
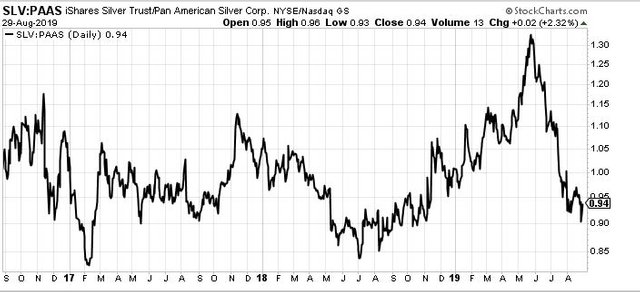
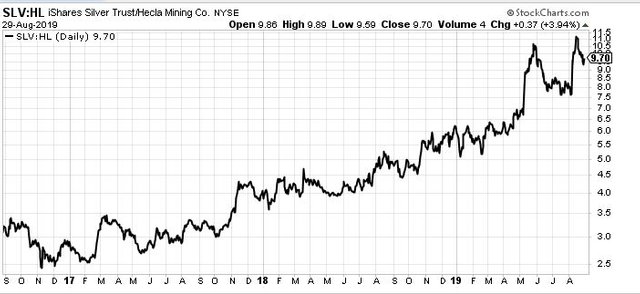
I wanted to explore silver mining opportunities using profits on silver trades noted above. First step is get a list of silver mining companies - found two lists for US and Canada listed stocks. Next step was to put together buy:sell charts for two stocks that I have previously invested in Pan American Silver Corp (PAAS) and Hecla Mining (HL). I used 3 years as this takes price back to the lows from the end of the last cycle.
The first chart shows that PAAS was under performing iShares Silver ETF (SLV) from mid 2018 and then turned over in mid 2019. Missed that boat
Buy:Sell Chart [Means: Buy the first named stock and sell the second named stock. If the chart goes up the first named stock is outperforming. If the chart goes down the second named stock is outperforming]
The next chart is quite different with Hecla Mining (HL) under performing all the way and only just recently showing signs of turning over.
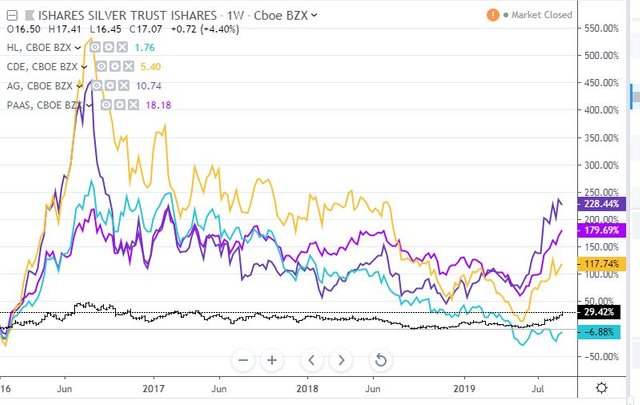
Normally that would be information enough to start building trade ideas. Stockcharts.com does not provide information on Toronto listings - so I went into my main charting program and looked at both US and Canadian listings - stacking the charts on top of each other. This is basically the same as a buy:sell chart but easier to see multiple stocks in one glance. First the US stocks stacked from best to worst: First Majestic Silver (AG), Pan American Silver (PAAS). Couer Mining (CDE) and Hecla Mining (HL)
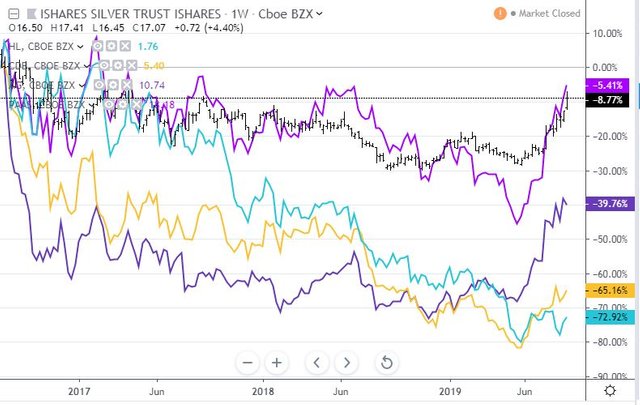
The chart shows quite strongly the massive multiplier effect with a rising silver price - see 47% rise in price in 2016 translate into a multiplier of 4 to 8 times in percentage terms on the mining stocks. Next step was to squeeze the chart in to run from the highs in 2016 so we can see a cycle from high to now.
What this does is change the order and show the relative under-performance to silver prices = this is the lag effect. What the chart also did was give me a second candidate to add to Hecla Mining (pale blue line) in Couer Mining (CDE - yellow line)
Now I did do the same analysis for the Canadian listed miners. Their tickers are EXN.TO, MAG.TO, USA.TO, FR.TO and WPM.TO. They all ranked better than my two candidates on this shorter cycle and their options markets are not as well developed as US listing.
So what did I do. My portfolios have different rules applying to them. In my pension portfolio, I cannot hold short positions without holding stock but I have cash to buy positions. So I bought stock positions and then bought bull call spreads. In a small portfolio, I do not have enough cash to buy stock and I cannot hold short positions so I bought calls which are expensive (but I had made great profits on the short term SLV call option I had sold). In the other two portfolios, I can hold short positions without buying stock so I bought bull call spreads. The time durations I chose were a mix of short term views and longer terms views all driving different trade sizes.
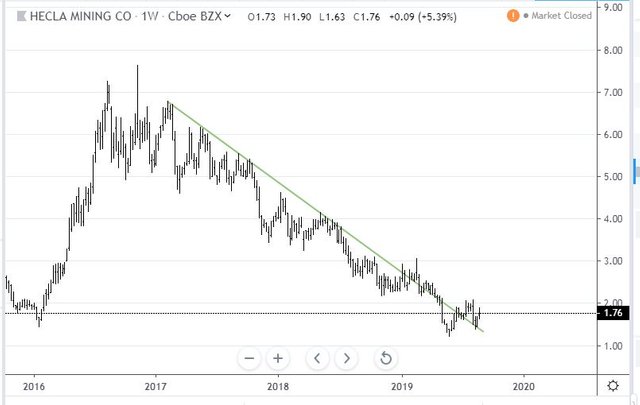
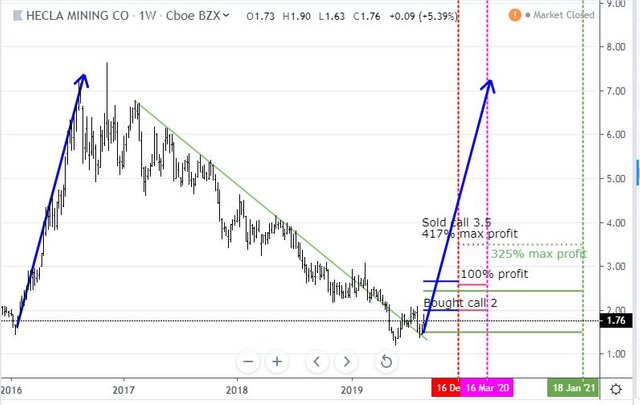
Hecla Mining Company (HL): Silver Mining. Bought stock in one portfolio and a March 2020 2/3.5 bull call spread with net premium of $0.29 offering maximum profit potential of 417% for a 90% increase in price from open of $1.84. Feels like a big stretch - can the share price double? First thing to do is look at the chart without any trades on it.
I have drawn in a weekly trend line. For some trend line drawers, this is an art. I apply two rules
- Start from the point at the top when it is clear the chart has turned over (first lower high)
- Draw through the closest touches. As this is a weekly chart I use the end points. For a daily I use closing prices (convert the chart to line chart and follow the reversals there)
Price has done what I like to see and broken the downtrend and done a retest. This is enough basis for me to buy the stock. A doubling in price would go back to 2018 highs = not that long ago. And price doubled twice plus a bit more in the 2016 move.
Now there is a begging question. Why is Hecla the worst of the silver mining stocks? It is viewed as the grand daddy of silver stocks (I read that somewhere. It has been mining silver for 128 years). It does mine quite a few other metals (gold = normal for a silver mine but also lead, zinc and copper) - that might be the drag.
https://www.hecla-mining.com/overview/
Bought December 2019 strike 2 call option in one portfolio. In the other two portfolios I bought a January 2021 1.5/3.5 bull call spread for net premium of $0.47 offering maximum profit potential of 325% - lower profit potential as trade was already $0.34 in-the-money at trade time and there was more time value to pay. Now for the chart with all the trades on. I have shown each of the trades with the bought call, 100% profit line in the middles and sold calls (dotted rays) with 3 expiry vertical lines
I have cloned across the 2016 price trajectory. Get a repeat of that from the retest and all trades will make the maximum before expiry. If the vertical move takes longer to start the close-in expiry trade will not win.
One snapshot of the options chains showing my sold calls as the sole trade. More important is how high implied volatility is = close to 100%. This is great for doing spreads BUT ugly for buying calls only.
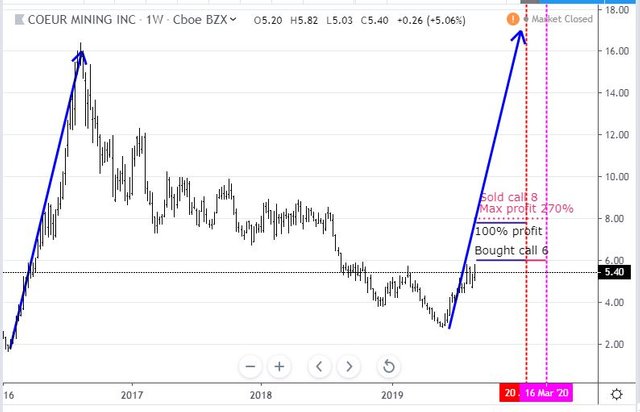
Coeur Mining, Inc (CDE): Silver Mining. The base chart is clear that price has broken the downtrend as are the buy:sell charts. 3 different trades here.
Bought stock in one portfolio. Bought January 2020 strike 6 call option in one portfolio. In the other two portfolios, bought March 2020 6/8 bull call spread for net premium of $0.54 which offers 270% maximum profit potential for 40% move in price from $5.71 opening price.
The chart shows the bought calls (all at 6), 100% profit line for the call only trade (blue rays) and the 6/8 bull call spread as pink rays.
Price has not started out as steeply as the 2016 blue arrow price scenario. We will really need to see how it moves after the current consolidation phase ends. All the trade needs is a move like the second half of the 2016 move after that brief consolidation in the middle of the move.
Shorts
Euribor 3 Month Interest Rate Futures (IZ): Europe Interest Rates. Closed out two December 2020 contracts to cover margin calls driven by falling crypto prices - losses over 100 basis points = 4 rate cuts. I figure that these negative interest rates are not going away. The price move was triggered by speech from Christine Lagarde. She really bothers me and she has not even started her new role at ECB.
Cryptocurency
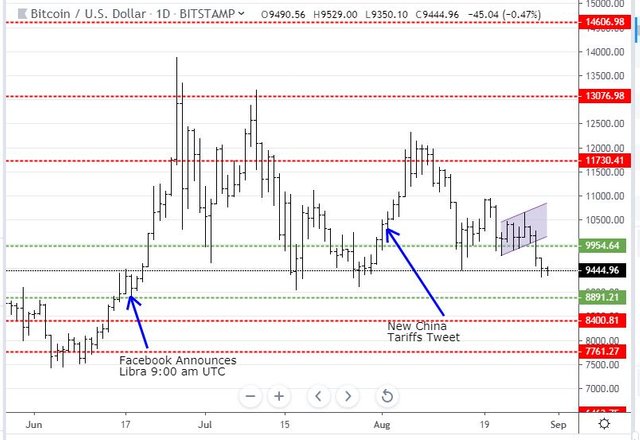
Bitcoin (BTCUSD): Price range for the day was $400 (4% of the high). Price just tracked down from the open which was the high for the day and took out the previous reversal low. The two lows just above $9,000 looks like the next zone.
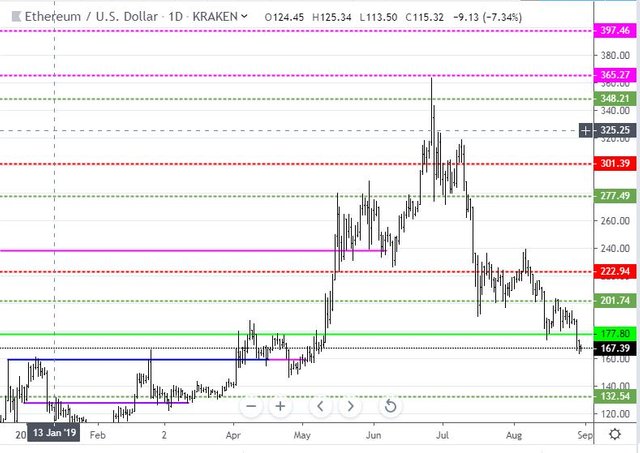
Ethereum (ETHUSD): Price range for the day was $10 (6% of the high). Just like Bitcoin, price pushed lower all day into a new "no mans land". Now there is a level which was respected in the past around $160 (the blue/pink ray)
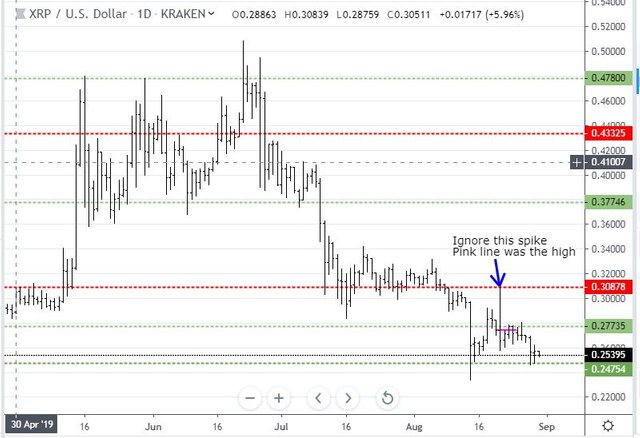
Ripple (XRPUSD): Price range for the day was $0.01515 (6% of the high). Price makes an inside bar and respects the support at 0.24754 - a difference from the other two coins.
CryptoBots
Profit Trailer Bot No closed trades
New Trading Bot Trading out using Crypto Prophecy. No closed trades
Currency Trades
Outsourced MAM account Actions to Wealth closed out 4 trades on CADCHF and AUDNZD for 0.34% losses for the day. Trades open short on USDJPY and USDCHF (0.92% negative). The open trades all look the same to me - risk off trades on a risk on day.
Cautions: This is not financial advice. You need to consider your own financial position and take your own advice before you follow any of my ideas
Images: I own the rights to use and edit the Buy Sell image. News headlines come from Google Search. All other images are created using my various trading and charting platforms. They are all my own work
Tickers: I monitor my portfolios using Yahoo Finance. The ticker symbols used are Yahoo Finance tickers
Charts: http://mymark.mx/TradingView - this is a free charting package. I have a Pro subscription to get access to real time forex prices
August 29, 2019


Silver definitely looks like a good setup as sentiment has clearly shifted when looking at futures positions among institutions as well. Let’s see if it pushes through this time as it has disappointed in the past!
Posted using Partiko iOS
Downvoting a post can decrease pending rewards and make it less visible. Common reasons:
Submit
It feels that way. The good news for my portfolios is I did time the turn in June. Now I am working with profits. One of lawyer advisers always used to talk about - OPM = other people's money. I like it.
Of course, there is a big risk in the trade. If Trump can pull off a China trade deal in 2019, it will slide back. That is fine too as the trade is really a hedging trade = the rest of the portfolios will benefit way more from a trade deal.
Downvoting a post can decrease pending rewards and make it less visible. Common reasons:
Submit
Hi, @carrinm!
You just got a 0.36% upvote from SteemPlus!
To get higher upvotes, earn more SteemPlus Points (SPP). On your Steemit wallet, check your SPP balance and click on "How to earn SPP?" to find out all the ways to earn.
If you're not using SteemPlus yet, please check our last posts in here to see the many ways in which SteemPlus can improve your Steem experience on Steemit and Busy.
Downvoting a post can decrease pending rewards and make it less visible. Common reasons:
Submit