Markets push to new highs on two successive days but not with much conviction. Worrying signs from first retail earnings. Buying back a few stocks assigned last week, some against the market trend. Also cherry picking for value opportunity in tech stocks. Lots of covered calls and a few naked puts

Portfolio News
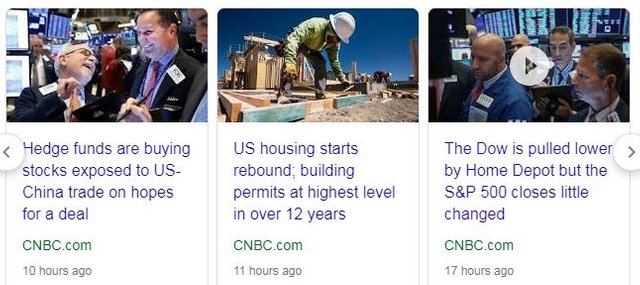
Market Rally
Markets push to a 13th record close for Nasdaq. Under the covers there is a rotation going into value stocks (PE's of 12 versus market around 18)
Bought
JinkoSolar Holding Co (JKS): Solar. Averaged down entry price in one portfolio. Jinko has been hammered by tariffs and removal of subsidies in China. Long term view on the future of solar. Looked like a hero today with price popping 10%
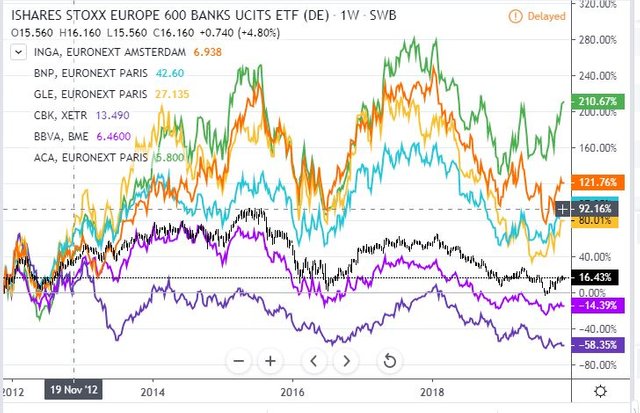
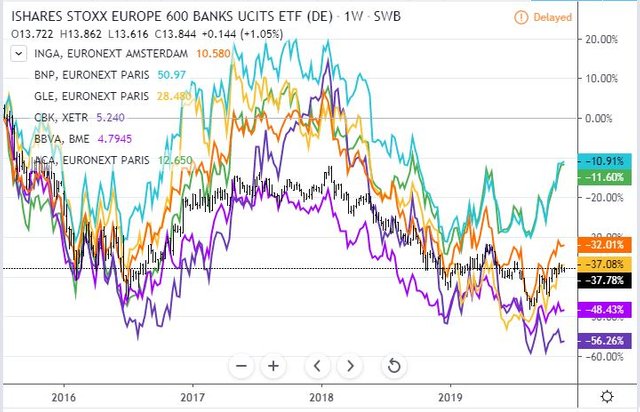
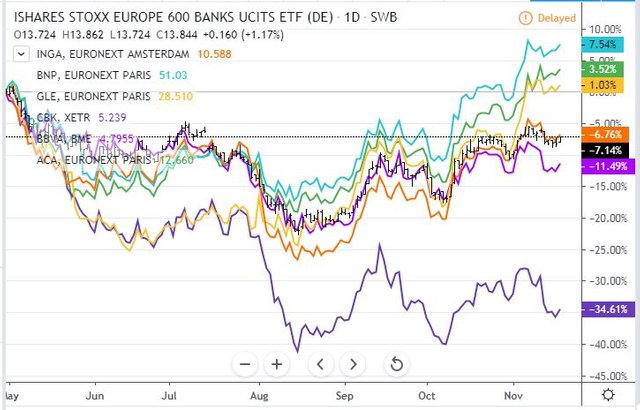
BNP Paribas (BNP.PA): French Bank. Added back a part holding of stock assigned in last week's covered calls. Was this the best European bank? Now time to make a chart. 3 charts comparing Stoxx600 Banks (black bars) to a selection of European banks.
On the cycle from the 2012 European debt crisis lows, best performer is Credit Agricole (ACA.PA - green line) with BNP (blue line) third 118 percentage points behind.
On the cycle from the 2015 highs, BNP is level pegging in the lead and still ahead of the sector.
On the cycle from the 2019 high, BNP is the leader. This would suggest that maybe a better buy would be a bank like ING Groep (INGA.AS - orange line) as it has space to make up. Of note is the strength of the 3 French banks - hence not unhappy with my decision.
Randstad NV (RAND.AS): Europe HR Services. Added back a part holding of stock assigned in last week's covered calls. My sense is Europe is doing better than markets have been valuing - this service will continue to grow.
Nokia Corporation (NOK): Europe Telecom Equipment. Averaged down holding in one portfolio. Talking heads are keen on 5G especially in its role for autonomous vehicles. Nokia is a leading European manufacturer and its price is not reflecting its 5G potential, especially if the boycott of China 5G suppliers continues.
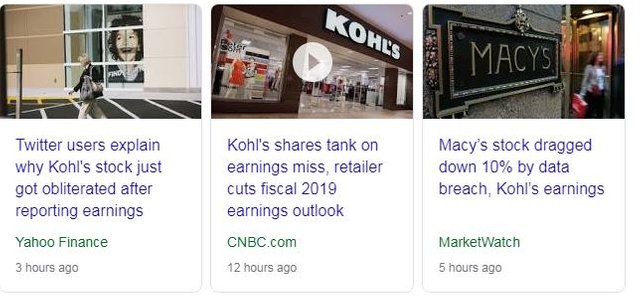
Kohls Corporation (KSS): US Retail. Kohls reported earnings which disappointed markets with a contraction of operating margins. Share price was smashed close to 20%.
Having had all my Kohls holdings assigned on Friday options expiry, I was looking like a hero for letting that happen. Added a small holding as 20% drop is way beyond the loss of value in the earnings - and immediately wrote a covered call with 1.85% premium.
Qualcomm (QCOM): US Semiconductors. Added to the small purchase I made last week to average down entry price and to be able to write covered calls. Talking heads were talking up 5G as an investing theme while Qualcomm conference call was putting pressure on its price - down 2.8% on the day.
Sold
The Walt Disney Company (DIS): US Media. With price closing at $147.65, closed out call spread leg of 135/145/120 call spread risk reversal for 74% profit. If I was to buy back the sold put today, profit would be 186%. I have left the sold put (120) open - would be an idea to exercise in both portfolios before the ex dividend date (December 6) (if I can as it will be out-the-money).
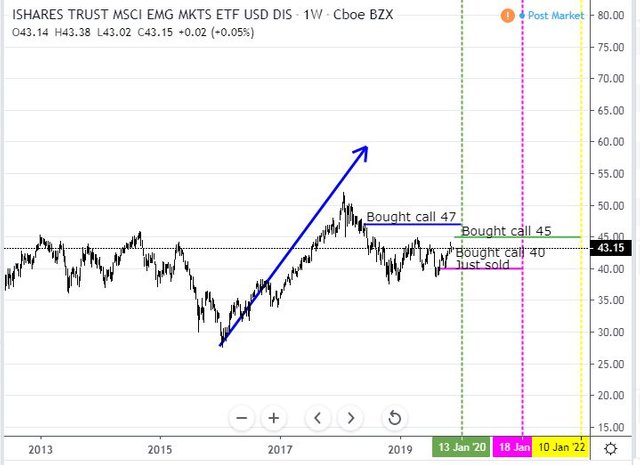
iShares MSCI Emerging Markets ETF (EEM): Emerging Markets Index. With price holding above $43, rolled up January 2021 strike 40 call options to January 2022 strike 45. Locks in 65% profit since August 2019. A quick look at the charts which shows 3 contracts (an older strike 47 call, the 40 strikes just sold and the new 45 call)
Price action is a long period of consolidation from early 2018 after the tariff driven sell off. The trade just closed (pink ray) was initiated as the trade talks started to make progress. The new trade is giving enough time for a positive conclusion to the trade talks. If that happens we could see a blue arrow price scenario (modelled on the run up from the 2009 lows). Get to 2018 highs and the new trade will make 100% profit and the old trade will break even
Income Trades
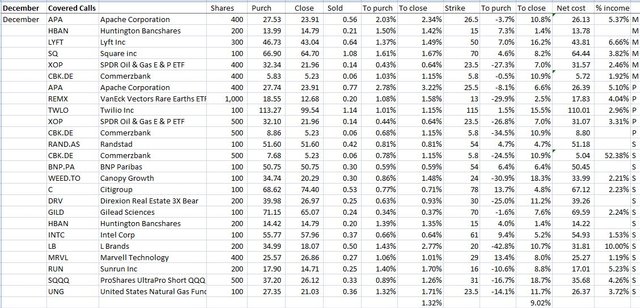
24 covered calls written on day one at average premium of 1.32% and coverage ratio of 9.02% - implied volatility is rising
14 covered calls written on day two at average premium of 1.24% and coverage ratio of 10.31%
Also wrote naked puts on McDonalds (MCD - 175 strike) and Honeywell (HON - 155 strike) for December and January expiries. Added a wrinkle to the covered call on Van Eck Vectors Strategic Metals/Rare Earths ETF (REMX). Price has been range bound since the end of August with only one foray below $12 and one above $13. So I sold strike 13 calls and strike 12 puts. All I want is price to do is stay between those two levels but I would be happy to buy at $12 if price dips.
Cryptocurency
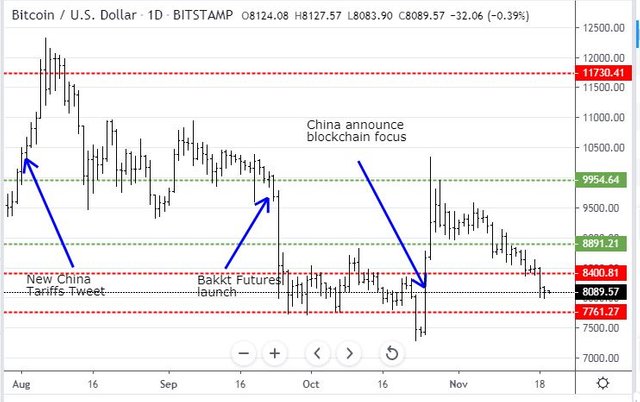
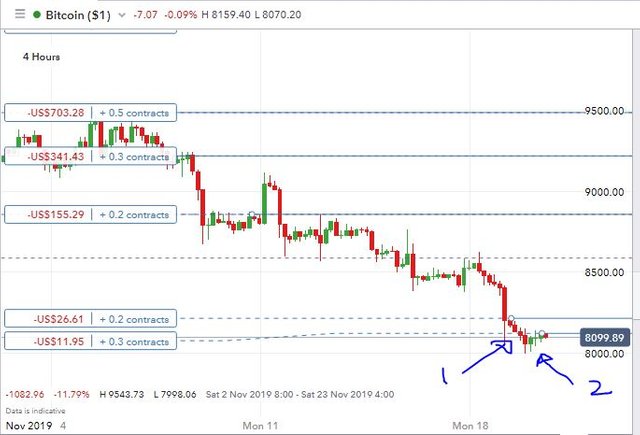
Bitcoin (BTCUSD): Price range for the two days was $519 (6% of the high). Price could not hold onto support at $8400 and dropped hard into no mans land - next level down is $7761.
This drop added to agriculture prices drove a margin call yesterday. I did make two trades - first was catching a falling knife. 2nd one looks a little tidier on a 4 hour chart.
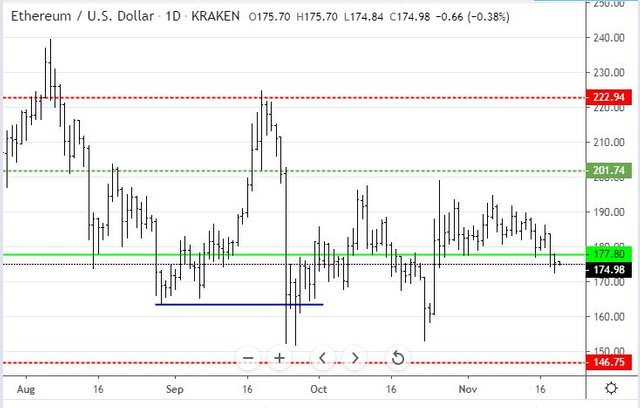
Ethereum (ETHUSD): Price range for the two days was $11 (6% of the high). Price dropped below support at $177 and failed to claw back above - it did try. The reversal here looks a bit more convincing
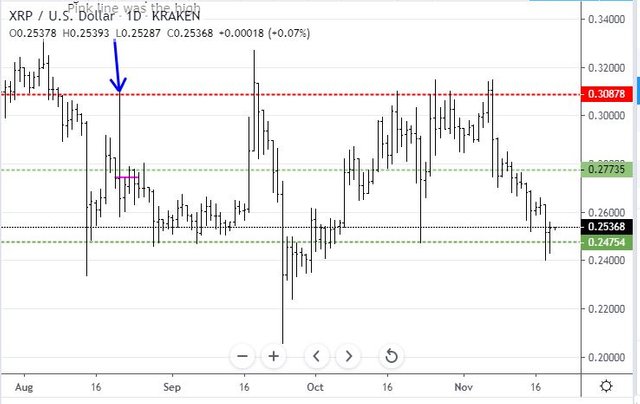
Ripple (XRPUSD): Price range for the two days was $0.02332 (8.8% of the high). Price dropped hard on day one making high and low in one day. Day 2 makes an inside bar holding above support at $0.24754 (a very important level).
CryptoBots
Profit Trailer Bot No closed trades
Currency Trades
Outsourced MAM account Actions to Wealth closed out 10 trades on USDCHF, UK100, AUDNZD for 0.27% profits for the two days. Trades open on AUDCAD, NZDUSD, EURUSD, USDJPY, EURNZD, (1.21% positive). While this is positive it feels like too many trades open at one time (10).
Cautions: This is not financial advice. You need to consider your own financial position and take your own advice before you follow any of my ideas
Images: I own the rights to use and edit the Buy Sell image. News headlines come from Google Search. All other images are created using my various trading and charting platforms. They are all my own work
Tickers: I monitor my portfolios using Yahoo Finance. The ticker symbols used are Yahoo Finance tickers
Charts: http://mymark.mx/TradingView - this is a free charting package. I have a Pro subscription to get access to real time forex prices
November 18-19, 2019


Hi, @carrinm!
You just got a 0.38% upvote from SteemPlus!
To get higher upvotes, earn more SteemPlus Points (SPP). On your Steemit wallet, check your SPP balance and click on "How to earn SPP?" to find out all the ways to earn.
If you're not using SteemPlus yet, please check our last posts in here to see the many ways in which SteemPlus can improve your Steem experience on Steemit and Busy.
Downvoting a post can decrease pending rewards and make it less visible. Common reasons:
Submit