The Standard & Poor’s 500 index rose 13 percent the first three months of the year, its best quarterly showing in a decade and the strongest first quarter since 1998, according to LPL Financial and FactSet.
Here’s the good news: The S&P 500 has gained 10 percent or more in the first quarter 10 previous times since 1950, and in nine cases it has notched further increases the rest of the year that have averaged 5.8 percent, according to LPL and FactSet.
Bottom line: LPL projects the S&P 500 will reach a record 3,000 by the end of the year, meaning an additional 6 percent gain is in the offing. That’s a decent return, though not much different from a diversified bond portfolio, according to LPL.
Perkin believes stocks can do a bit better, with up to an 8 percent additional surge as the economy and corporate profits rise more than expected.
This is the same thing Edward Yardeni said two months ago.

Ed spent decades on Wall Street running investment strategy for firms such as Prudential and Deutsche Bank, predicts stocks will break out to all-time highs this year. He’s partly building his bull case based on a chart pointing to negative market sentiment.
“I’m still sticking with 3100 and feel better about it,” said Yardeni, who noted valuation multiples, low interest rates and inflation is setting Wall Street up for a very good year.
Will The S&P 500 Make All-Time New Highs In 2019???
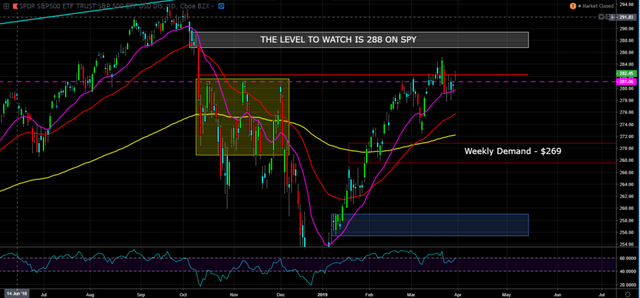
Does Perkins and Ed have a point? At the moment the daily chart is supporting their thesis. There was a golden cross in early March and the 200 day moving avg (yellow line is sloping up now).
NOTE: Golden Cross - a bullish breakout pattern formed from a crossover involving a security's short-term moving average (50 day MA - red line) breaking above its long-term moving average (200 day MA - yellow line).

In additional, the Market Internals are supporting Perkins' and Ed's thesis as well.
The advance/decline line (A/D) is a technical indicator that plots the difference between the number of advancing and declining stocks on a daily basis. The indicator is cumulative, with a positive number being added to the prior number, or if the number is negative it is subtracted from the prior number.
The A/D line is used to show market sentiment, as it tells traders whether there are more stocks rising or falling. It is used to confirm price trends in major indexes, and can also warn of reversals when divergence occurs.
In this case the cumulative A/D line is at all-time new highs.

On Friday, Trump said that trade talks with China were going very well, but cautioned that he would not accept anything less than a “great deal.” Thus, the the US-China trade talks hold the keys to new highs in my opinion. It's a wait and see approach the Smart Money is talking because nobody wants to be short the Markets with the potential of a trade deal in the works. However, if a deal doesn't get done..well, the Perkins / Ed thesis is off the table.
Will The S&P 500 Make All-Time New Highs In 2019??? - Part 2
Will The S&P 500 Make All-Time New Highs In 2019??? - Part 3
This post is my personal opinion. I’m not a financial advisor, this isn't financial advise. Do your own research before making investment decisions.


very good post. i like your analysis.
Downvoting a post can decrease pending rewards and make it less visible. Common reasons:
Submit
Thanks @travelfox, glad you are enjoying them.
Downvoting a post can decrease pending rewards and make it less visible. Common reasons:
Submit
All your analysis' are really good mate, have you noted the NASDAQ and S&P Daily reversal candles? I'll be sure to recommend you and your analysis' in my posts about becoming a tea time trader!
Downvoting a post can decrease pending rewards and make it less visible. Common reasons:
Submit
Thanks @blurbanco. I can't say I see the reversal candles, but
The Dow hanging around monthly supply
Nasdaq nearing daily supply
Are you from England???
Downvoting a post can decrease pending rewards and make it less visible. Common reasons:
Submit
That most recent red candle of yours on the NASDAQ chart has been picked up by a couple of analysts from the platform I use but it's up against that golden cross situation too! Your charts are clean and offer a good short term support and resistance, do you have a recent set up for WTI Oil? I would be interested to see that for sure. Yes my friend, I am from England, are you from the US?
Downvoting a post can decrease pending rewards and make it less visible. Common reasons:
Submit
While the trend is your friend, the market seems to be rotating into a more cyclical downturn setup. I can’t see earning growth with measures that will eat into other sectors of the economy (i.e. unemployment, capex reductions, etc.). We may have a strong market but it will be met with strong selling from the smart money as retail investors are drawn in.
Posted using Partiko iOS
Downvoting a post can decrease pending rewards and make it less visible. Common reasons:
Submit
The markets will grind a bit higher, but it will be a bit harder, until the smart money can get their order out of the markets.
Downvoting a post can decrease pending rewards and make it less visible. Common reasons:
Submit