01 
I've been running after the Shiba Inu coin for about a year and thought I'd share my thoughts with you guys.
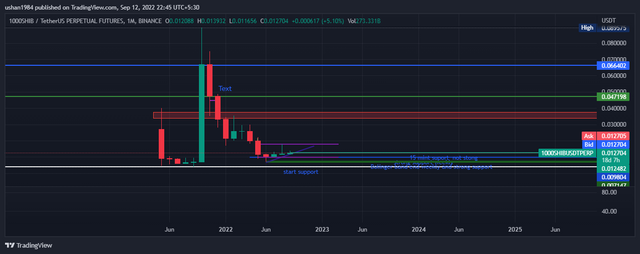
The first picture is the Shiba monthly chart and the special thing about this is that it has shown some growth in the last 3 months. I think this is the beginning of a 2nd bull run.
click here https://www.tradingview.com/x/6DMMMobJ/ to link

This is the weekly chart and Shiba bounces from the line shown in green color and it is between the lower of the Bollinger Band and when Bitcoin fell, Shiba was holding this line.

Expanding further in the yellow triangle, Shiba finds his way and bounces back to the support indicated mostly in white.
https://www.tradingview.com/x/rb3u7MoI/

As the rsi divergence indexer turns bullish in the daily chart, some favorable conditions can be expected for further price rise.