Red Tribe Analysis
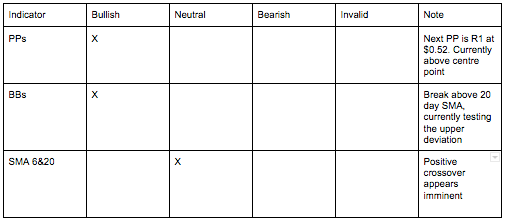
IOTA/USD indicators
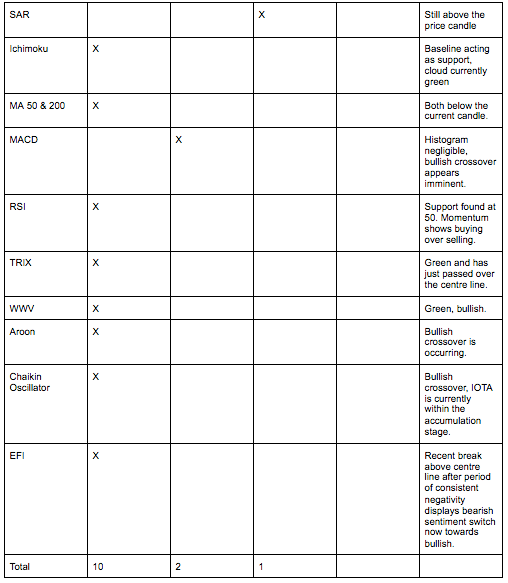
IOTA conclusion
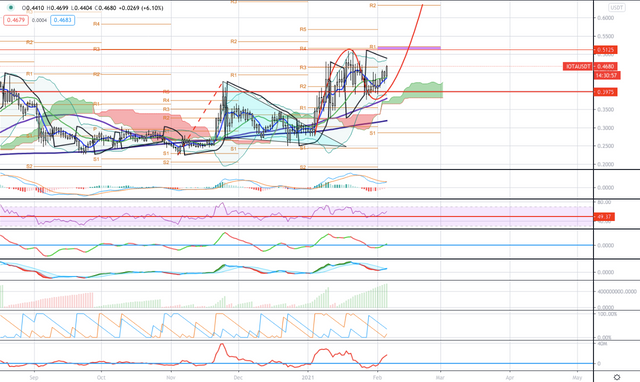
IOTA currently has no real patterns forming when looking at the IOTA / USDT chart (hence no chart with trend lines or formations). However when looking at the indicators it is clear which direction IOTA is planning on moving. The main challenge for IOTA is to close and break above the multi-year $0.5 USD resistance level. If this is broken above, then IOTA will likely increase in price substantially, with the next aim $0.6618 and then $0.8751 USD. For this to occur, we will need to see bullish price action from ETH and BTC due to IOTA constantly being heavily hit when BTC or ETH lose significant value. IOTA currently has significant support at $0.4 USD (0.618 retracement & central PP) and $0.3845 (50 day SMA & 0.5 Fib). Therefore there is a heavy support zone for IOTA between $0.4 - $0.38 USD.
IOTA price targets
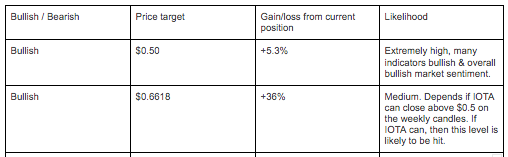
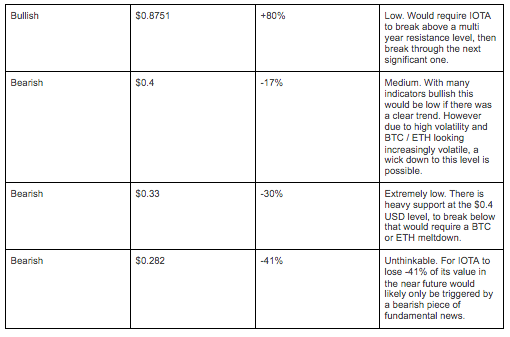
All in all IOTA has been out-performed by many cryptocurrencies. Although don’t be surprised to see IOTA flex its muscles with some serious price action as traders look for the next alt coin to bring them some substantial returns.
Join the Red Tribe free Telegram trading channel - https://t.me/red_tribe