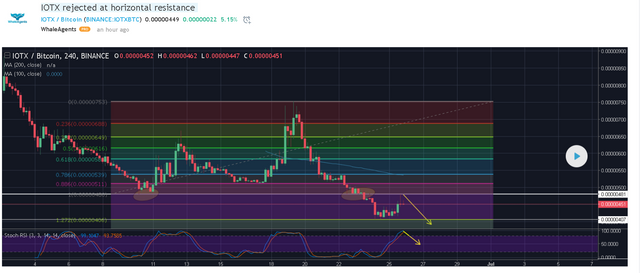
IOTX pushed below previous low around 0.00000481, closed and then returned to re-test the previous support, now acting as strong resistance. In a perfect manner, the price touched the horizontal resistance and immediately turned lower to create a shooting star - bearish candlestick pattern. We expect the price to rotate back lower and re-test recent low at 0.00000406, which represents a 127.2% extension. Furthermore, RSI is currently in the overbought territory and a move back lower is to be expected.
A perfect scenario with this background would be break through 127.2% and move to 161.8% - key Fibonacci extension level, which sits at 0.00000312. If you are looking to buy IOTX and hold in the mid-term, our advise is to wait for this level to be tested before dipping into the market.
Join Our Cryptocurrency signals Telegram Channel
Follow us on Twitter
Visit our Official Website
About us
Original post in our Tradingview profile