BTC - daily time frame MACD
For this strategy, the MACD is the base indicator. Other indicators are used for potential validation / concerns for stop losses, likelihood of successful trade which should therefore potentially affect what % of your portfolio you assign towards a trade. Like usual this is not financial advice and is for educational purposes only.
Two timeframe periods taken. Bought / Sold at any crossover. Closure of the candle was waited for. The strategy is using the daily timeframe.
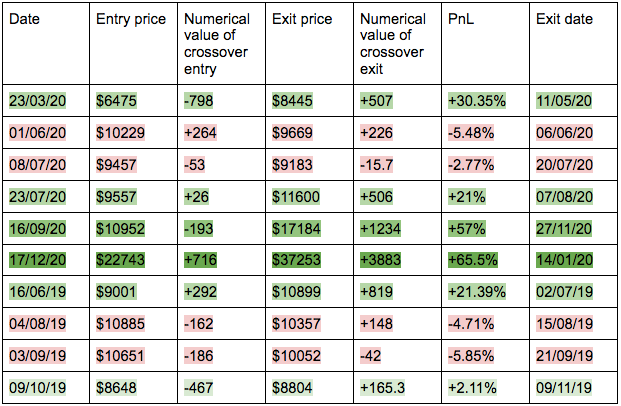
Gann HL standard setting
Blue = bullish
Brown = bearish
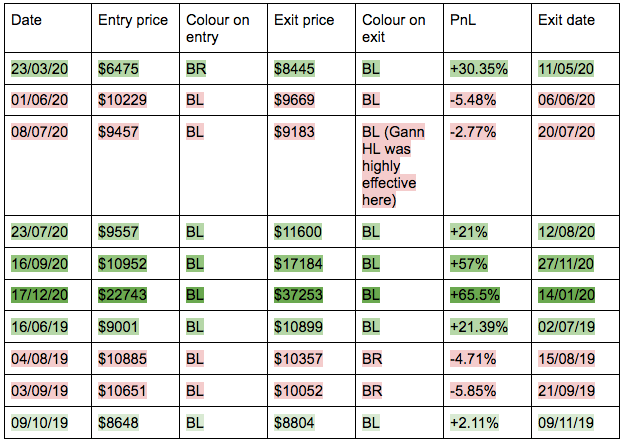
Data conclusion = the standard 13/21 setup was too laggy and did not supply reactive enough signals to avoid significant losses.
Gann HL 9/15 setup
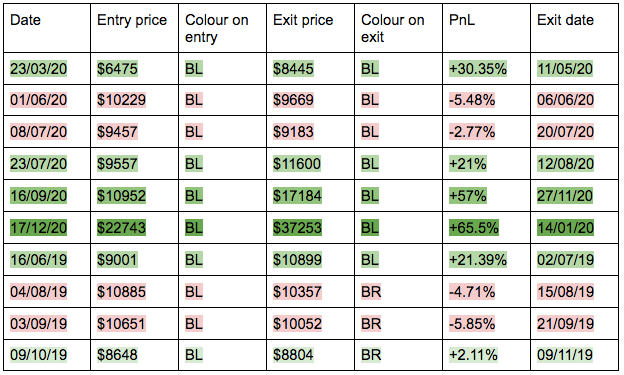
Indicator conclusion = The Gann HL is ineffective at measuring potential long positions alongside the MACD as the indicator is still too laggy. Although when looking at exiting, if the Gann HL is brown - this should be a major warning sign to close your position. Equally if the Gann HL is brown on entry with the 9/15 setup, the market is likely in a bearish state. Therefore the Gann HL is advising caution.
Pivot Points PPs
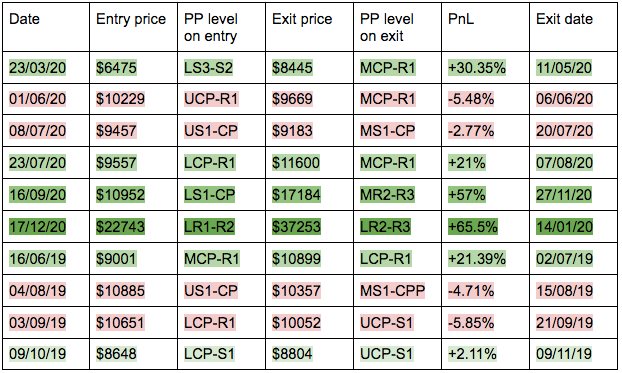
If entering on a lower PP likelihood of successful trade is increased = 83%
If entering on an upper PP likelihood of successful trade is decreased = 0%
Closure dependent on PP position should not be taken into account as hanging on increases likelihood of trade failure.
If entering on an upper PP, portfolio exposure should be decreased, while stop losses could be potentially tighter.
SAR
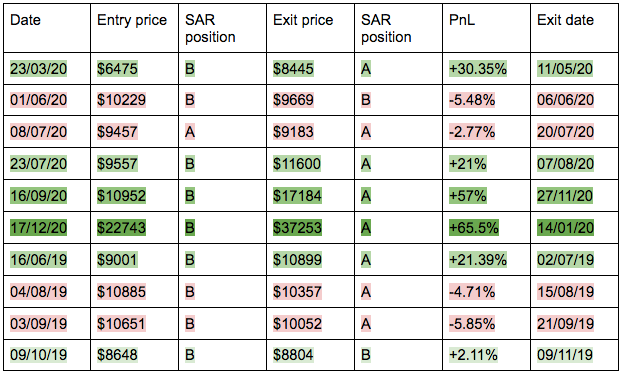
Buying at B success rate = 66.6%
Buying at A success rate = 0%
Selling at B success rate = 50%
Selling at A success rate = 62.5%
Data conclusion - If there is a MACD signal for BTC when the SAR is below the current price candle then a long position could be taken. However if the SAR is above the candle then a long position should not be taken. If the SAR is above then a long position should be cut. However if the SAR is above, losses may need to be cut and re-entry further down the line should be looked at.
Bollinger Bands
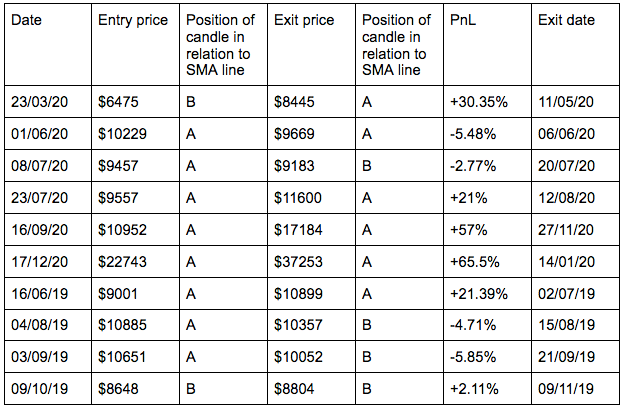
Data conclusion - Bollinger Bands are not effective when looking for buy/sell signals with BTC.
Volatility indicator
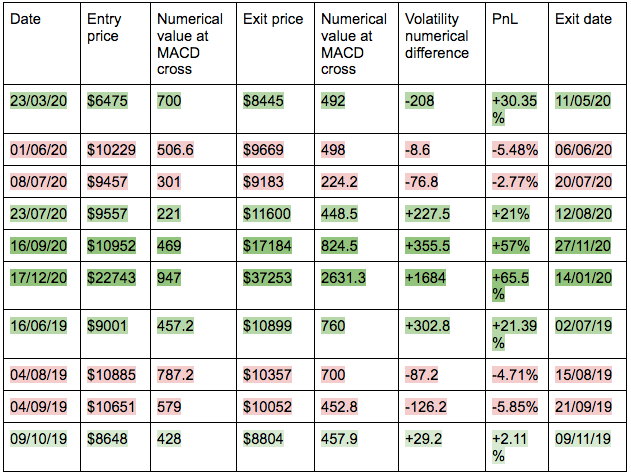
Data conclusion = Increased volatility difference increases likelihood of successful trade. Therefore the implied method of using indicators is superior in a volatile market state.
Chaikin Oscillator
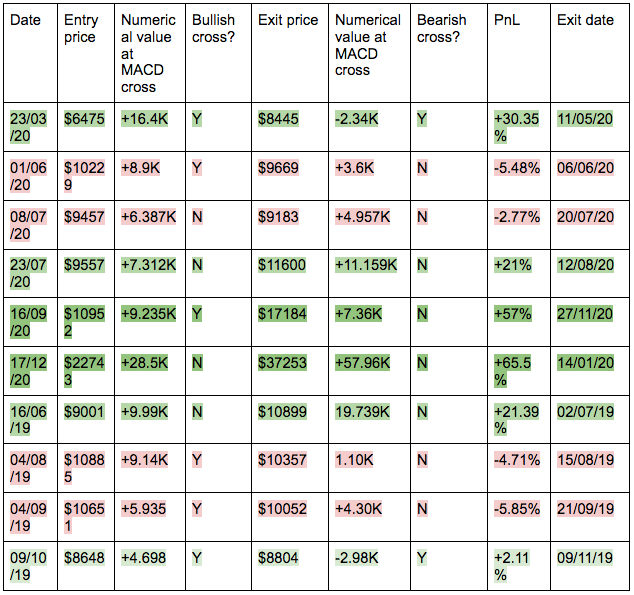
Conclusion = overall the indicator is ineffective in this strategy.
Conclusion of potential strategy.
The data provided shows that the strategy is most effective in volatile markets, however in non-volatile markets the strategy produces false buy signals/ sell signals. This does not entirely matter due to the low likelihood of a sharp fall off. However the buy / sell signal should still be taken. Overall effective, profitable, very simple and easy to employ.
Red Tribe website - redtribe.xyz
Red Tribe free Telegram channel - https://t.me/red_tribe