The stocks/crypto market is a complex and dynamic system that involves millions of data points, human emotions, and unpredictable events. It can be challenging for investors to analyze the market, find the best opportunities, and execute trades at the right time.
Fortunately, artificial intelligence (AI) can help investors overcome these challenges and gain an edge in the stock market. AI is a branch of computer science that aims to create machines and systems that can perform tasks that normally require human intelligence, such as learning, reasoning, and decision making.
AI can be applied to various aspects of the stock market, such as:
- Data analysis: AI can process large amounts of data from various sources, such as historical prices, volumes, news articles, social media posts, earnings reports, and more. AI can also use techniques such as machine learning and natural language processing to extract relevant information, identify patterns, and generate insights from the data.
- Investment ideas: AI can use data analysis to discover potential investment opportunities based on various criteria, such as risk-reward ratio, growth potential, valuation, momentum, and more. AI can also use sentiment analysis to gauge the mood and opinions of the market participants and predict how they will affect the stock prices.
- Portfolio management: AI can help investors build and optimize their portfolios based on their goals, preferences, and risk tolerance. AI can also monitor the performance of the portfolios and suggest adjustments or rebalancing when needed.
- Trading execution: AI can help investors execute their trades at the optimal price and time. AI can use algorithms to analyze the market conditions, liquidity, volatility, and other factors and place orders accordingly. AI can also use high-frequency trading to exploit short-term price movements and arbitrage opportunities.
How to Predict and Forecast the Market with Python Tools and Google Colab
One of the ways to use AI for stock market analysis is to use Python tools and Google Colab. Python is a popular programming language that has many libraries and frameworks for data science and AI, such as pandas, numpy, scikit-learn, TensorFlow, PyTorch, and more. Google Colab is a free online platform that allows users to write and run Python code in a web browser, using Google’s cloud computing resources.
Using Python tools and Google Colab, investors can perform various tasks, such as:
- Data collection: Investors can use Python libraries such as pandas-datareader, yfinance, or alpha_vantage to access and download stock market data from various sources, such as Yahoo Finance, Alpha Vantage, or Quandl. Investors can also use Python libraries such as requests or BeautifulSoup to scrape data from websites or APIs.
- Data exploration: Investors can use Python libraries such as pandas, numpy, or matplotlib to explore and visualize the data, such as calculating descriptive statistics, plotting charts, histograms, or heatmaps, or finding correlations or outliers.
- Data preprocessing: Investors can use Python libraries such as pandas, numpy, or sklearn to preprocess the data, such as cleaning, filtering, scaling, normalizing, or transforming the data to make it suitable for AI models.
- Data modeling: Investors can use Python libraries such as sklearn, TensorFlow, PyTorch, or Keras to build and train AI models for stock market prediction and forecasting. Investors can choose from various types of models, such as regression, classification, clustering, or time series analysis. Investors can also use techniques such as cross-validation, grid search, or hyperparameter tuning to optimize the performance of the models.
- Data evaluation: Investors can use Python libraries such as sklearn, TensorFlow, PyTorch, or Keras to evaluate the accuracy and reliability of the AI models. Investors can use metrics such as mean squared error (MSE), root mean squared error (RMSE), mean absolute error (MAE), accuracy score (ACC), precision score (PRC), recall score (REC), or F1 score (F1) to measure the performance of the models. Investors can also use techniques such as confusion matrix, ROC curve, or AUC score to visualize the results of the models.
To use Python tools and Google Colab for stock market analysis, investors need to follow these steps:
- Create a Google account: Investors need to have a Google account to access Google Colab. They can sign up for a free account here: Google Account Signup
- Open Google Colab: Investors need to open Google Colab in their web browser. They can access it here: Google Colab
- Create a new notebook: Investors need to create a new notebook in Google Colab. They can click on the File menu and select New notebook. They can also rename the notebook by clicking on the Untitled text at the top left corner of the screen.
- Write and run Python code: Investors can write and run Python code in the cells of the notebook. They can use the +Code button to add a new code cell, or the +Text button to add a new text cell. They can also use the Run button or the Ctrl+Enter shortcut to execute the code in a cell. They can also use the
#symbol to add comments to their code. - Save and share the notebook: Investors can save and share their notebook in Google Colab. They can click on the File menu and select Save or Save a copy in Drive. They can also click on the Share button at the top right corner of the screen to share their notebook with others.

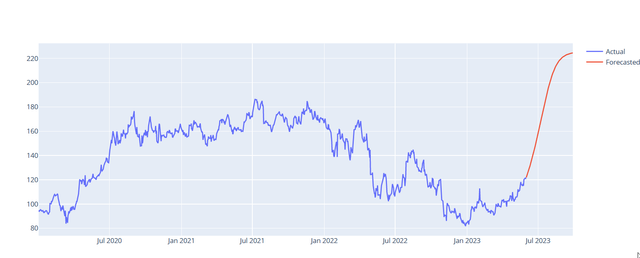
Sample LTSM Prediction Code
LSTM stands for Long Short-Term Memory, which is a type of recurrent neural network that can learn long-term dependencies in sequential data. LSTM is useful for predicting stock prices because it can capture the temporal patterns and trends in the historical data. LSTM can also retain past information and avoid the problem of vanishing gradients that affects other recurrent neural networks.
One way to use LSTM with Machine Learning to forecast stock prices is to train an LSTM model on a window of consecutive samples from the historical data, and then use the model to predict the next day’s stock price based on the previous window. For example, if we use a window of 21 days, the model will learn from the past 21 days of stock prices and try to forecast the 22nd day’s price34. This process can be repeated for different windows and different stocks to generate predictions for various scenarios. However, it is important to note that the predicted stock prices should not be used as a sole guide for investment decisions without further analysis, as stock market prices are highly unpredictable and volatile.
Here is some sample forecasting code I wrote for you to start you predicting stocks. Use stock ticker like NVDA instead of BTC-USD if you want to look at stocks.
import yfinance as yf
from sklearn.preprocessing import MinMaxScaler
from keras.models import Sequential
from keras.layers import LSTM, Dense
from datetime import date, timedelta
import pandas as pd
import numpy as np
import plotly.graph_objects as go

# Get the historical data for AAPL
data = yf.download('BTC-USD', start='2020-01-01', end=date.today())

# Prepare data for LSTM
close_price = data['Close'].values.reshape(-1, 1)
scaler = MinMaxScaler(feature_range=(0, 1))
scaled_data = scaler.fit_transform(close_price)

days_to_predict = 120

# Create a data structure with days_to_predict timestamps and 1 output
x_train, y_train = [], []
for i in range(days_to_predict, len(scaled_data)):
    x_train.append(scaled_data[i-days_to_predict:i, 0])
    y_train.append(scaled_data[i, 0])
x_train, y_train = np.array(x_train), np.array(y_train)
x_train = np.reshape(x_train, (x_train.shape[0], x_train.shape[1], 1))

# Create and fit the LSTM network
model = Sequential()
model.add(LSTM(units=50, return_sequences=True, input_shape=(x_train.shape[1], 1)))
model.add(LSTM(units=50))
model.add(Dense(1))

model.compile(loss='mean_squared_error', optimizer='adam')
model.fit(x_train, y_train, epochs=1, batch_size=1, verbose=2)

# Prepare to predict for the next x days
inputs = close_price[len(close_price) - days_to_predict:]
inputs = inputs.reshape(-1,1)
inputs  = scaler.transform(inputs)

# Create a data structure for the forecasting period
X_test = []
X_test.append(inputs[0:days_to_predict, 0])
X_test = np.array(X_test)
X_test = np.reshape(X_test, (X_test.shape[0], X_test.shape[1], 1))

closing_price = []

# Generate forecast
for i in range(days_to_predict):
    predicted_price = model.predict(X_test)
    X_test = np.append(X_test[0,1:days_to_predict], predicted_price)
    X_test = X_test.reshape(1,days_to_predict,1)
    predicted_price = scaler.inverse_transform(predicted_price)
    closing_price.append(predicted_price[0,0])

# Create a dataframe to map the forecasted prices
df_forecasted = pd.DataFrame({'Forecasted': closing_price}, index=pd.date_range(start=data.index[-1] + timedelta(days=1), periods=days_to_predict))

# Plotting
fig = go.Figure()

# Actual closing price
fig.add_trace(go.Scatter(x=data.index, y=data['Close'],
                    mode='lines',
                    name='Actual'))

# Forecasted closing price
fig.add_trace(go.Scatter(x=df_forecasted.index, y=df_forecasted['Forecasted'],
                    mode='lines',
                    name='Forecasted'))

fig.show()

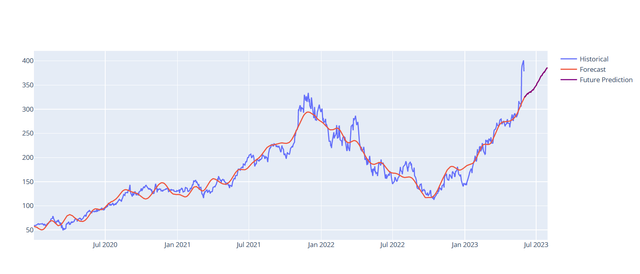
Sample Prophet Code
FBProphet is based on an additive model where non-linear trends are fit with yearly, weekly, and daily seasonality, plus holiday effects. It works best with time series that have strong seasonal effects and several seasons of historical data. FBProphet is robust to missing data and shifts in the trend, and typically handles outliers well. FBProphet is open source software released by Facebook's Core Data Science team.
Here is some sample code I made to show what it is capable of:
!pip install prophet
import yfinance as yf
from datetime import date, timedelta
import pandas as pd
import numpy as np
import plotly.graph_objects as go
from prophet import Prophet

symbol = "AAPL"
# Get the historical data for AAPL
data = yf.download(symbol, start='2020-01-01', end=date.today())
df = data.reset_index()[['Date', 'Close']]
df = df.rename(columns={'Date': 'ds', 'Close': 'y'})
model = Prophet(daily_seasonality=True)
model.fit(df)
forecast_days = 60
future = model.make_future_dataframe(periods=forecast_days)
forecast = model.predict(future)

fig = go.Figure()
fig.add_trace(go.Scatter(x=df['ds'], y=df['y'], mode='lines', name='Historical'))
fig.add_trace(go.Scatter(x=forecast['ds'], y=forecast['yhat'], mode='lines', name='Forecast'))
fig.add_trace(go.Scatter(x=forecast['ds'].tail(forecast_days), y=forecast['yhat'].tail(forecast_days), mode='lines', name='Future Prediction', line=dict(color='purple')))
fig.show()

forecasted = forecast['yhat'].tail(forecast_days)
actual = df['y'].tail(forecast_days)
mape = np.mean(np.abs((np.array(actual) - np.array(forecasted)) / np.array(actual))) * 100
print(f"Mean Absolute Percentage Error for Prophet Forecast: {mape}%")

predicted_price = forecast['yhat'].iloc[-1]
current_price = df['y'].iloc[-1]

if predicted_price > current_price:
    print(f"💰 The predicted price for {symbol} at the end of 60 days is higher than the current price. Recommendation: BUY")
elif predicted_price < current_price:
    print(f"The predicted price for {symbol} at the end of 60 days is lower than the current price. Recommendation: SELL")
Conclusion
AI is a powerful tool that can help investors capitalize on the stock market. AI can perform various tasks, such as data analysis, investment ideas, portfolio management, and trading execution, that can improve the efficiency, accuracy, and profitability of investing. Investors can also use Python tools and Google Colab to perform stock market prediction and forecasting using AI models.
However, AI is not a magic bullet that can guarantee success in the stock market. AI still has limitations, such as data quality, model complexity, interpretability, and ethics, that investors need to be aware of and address. Investors also need to have a solid understanding of the fundamentals of the stock market, such as valuation, risk management, and diversification, and use their own judgment and intuition to complement AI.
Therefore, investors should use AI as a tool, not a substitute, for their stock market analysis. By doing so, they can leverage the benefits of AI while avoiding its pitfalls and achieve their investing goals.
Related Article: How To Get Rich With Bitcoin Even If You Have No Clue About Technology