Key Points
---Bitcoin price formed a decent support near $6,050 and recovered against the US Dollar.
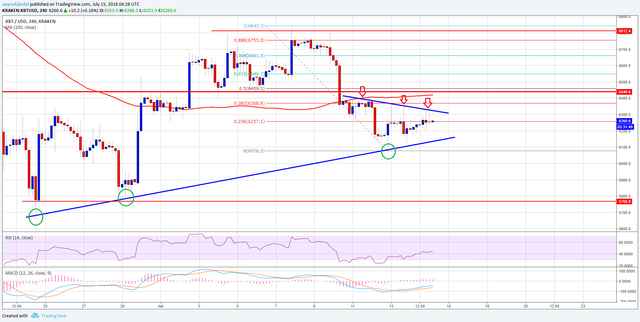
---There is a key triangle forming with resistance near $6,300 on the 4-hours chart of the BTC/USD pair (data feed from Kraken).
---The pair is facing many hurdles on the upside near the $6,300 and $6,450 levels.
---Bitcoin price is preparing for the next move above $6,300 against the US Dollar. BTC/USD could trade higher if buyers succeed in pushing the price above $6,450.
Bitcoin Price Resistances
This past week, there was a sharp downward move from well above $6,750 in bitcoin price against the US Dollar. The BTC/USD pair topped near the $6,840 level and declined below the $6,450 support area. The drop was such that the price settled below $6,450 and the 100 simple moving average (4-hours). However, buyers took a stand near the $6,075 level and prevented further slides.
A low was formed at $6,076 and the price started an upward correction. It moved a few points above the 23.6% Fib retracement level of the last decline from the $6,842 high to $6,076 low. However, the upside move was prevented by the $6,360 level. More importantly, there is a key triangle forming with resistance near $6,300 on the 4-hours chart of the BTC/USD pair. Above the triangle resistance, there is a crucial resistance near $6,440, which is near the 100 SMA. Moreover, the 50% Fib retracement level of the last decline from the $6,842 high to $6,076 low is at $6,459. Therefore, the $6,450-60 zone could act as a strong resistance.

Looking at the chart, the price is approaching a key break either above $6,300 or below $6,175. Below $6,175, the $6,000 support may be tested, followed by $5,800. On the other hand, above $6,300, the price will most likely break $6,450.
Looking at the technical indicators:
4-hours MACD – The MACD for BTC/USD is slowly gaining pace in the bullish zone.
4-hours RSI (Relative Strength Index) – The RSI is now above the 40 level.
Major Support Level – $6,000
Major Resistance Level – $6,450
best of luck
PLEASE GIVE YOUR SUGGESTIONS BELOW....
Its a nice post hopa so bitcoin rally will come soon .do check my post also
Downvoting a post can decrease pending rewards and make it less visible. Common reasons:
Submit
hello , I upvoted your latest 5 posts , you also do the same
Downvoting a post can decrease pending rewards and make it less visible. Common reasons:
Submit
Ok dear
Downvoting a post can decrease pending rewards and make it less visible. Common reasons:
Submit
Hi! I am a robot. I just upvoted you! I found similar content that readers might be interested in:
http://freebitcoin.directory/bitcoin-price-weekly-analysis-btc-usds-triangle-break-near/
Downvoting a post can decrease pending rewards and make it less visible. Common reasons:
Submit
Downvoting a post can decrease pending rewards and make it less visible. Common reasons:
Submit