Good afternoon.
Analysis of the company's value growth
In this part, I will continue to analyze the company's growth in the new financial model of the company's analysis.

I presented here the matrix, which I analyzed in the previous material, and made small changes to it.

Instead of the growth rate of market capitalization, I will use the spread of the return on invested capital, which is the difference between the actually earned return and the required return on the company's investment risks.
The yield spread, equal to zero, means that the company earns as much as it should in accordance with the risks.
All that is on the right is a positive spread of profitability, the company successfully creates value.
All that is on the left is a negative spread of profitability, the company is in a situation of decreasing business value.

Such studies are better conducted on a group of companies, many processes become better visible. Both matrices were built according to public companies. In the course of the conducted studies, it was concluded that in general the location of companies in the two matrices is the same.
Why is this conclusion important? Because in the matrix, which I am considering in this part, the spread of the yield spread is invisible, it is not in the reporting of companies, it is not in other materials. This indicator is analytical, and yet the matrices of the first and second kind distributed the company approximately identically in terms of growth.
In some moments, the location of companies in the matrix did not match, and there is an explanation for this. The first matrix is made on the basis of market capitalization.

Market capitalization is a very subtle concept. It is influenced by investors' expectations. Investors can be optimistic or pessimistic, may inadequately react to some events.
In addition to internal processes, capitalization is influenced also by external processes, the state of the industry, the state of the economy, political processes in the country or abroad.
And the difference in location in the matrices is caused by the investors' wrong expectations, the discrepancy between their expectations and those processes that occur in the company.
These findings mean that this matrix can be applied to non-public companies that do not have a market capitalization.
It is difficult to calculate the spreads of the return on invested capital for non-public companies, but it is possible, and this allows us to see the growth rates.
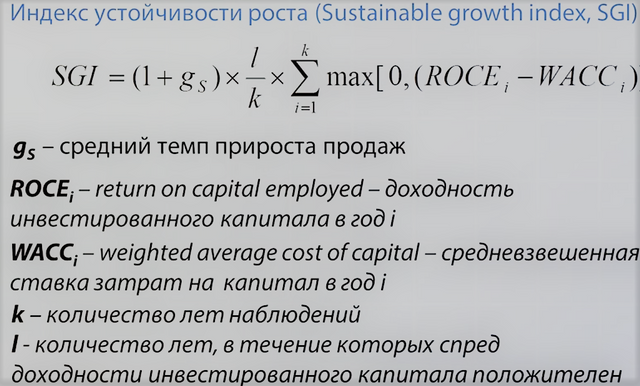
There is also another tool for analyzing the growth of the company. This is an analysis of growth through the prism of value in terms of sustainability of the company's growth.
I propose an index consisting of three factors.

The first multiplier outlines the strategic aspect of the company's growth, because it includes the growth rate of sales.
The second factor is presented in the form of the ratio: the number of years when the company has positive spreads, (l), attributed to the entire observation period, (k).
The third multiplier shows the potential for creating economic profits and suggests that you need to analyze the positive spreads of return on invested capital and summarize them. If the company's positive yield spreads are very rare, then the third multiplier will be quite modest.
If you use this index, you will not need to build significant, detailed and detailed methods for valuing the company.
But with the simplification of calculations, important essential characteristics will not be missed. It would be important and useful if the management teams could discuss strategic development scenarios using this index and its parameters.
Summing up the comparison of the matrices, I want to say that during the research there were no situations when a company with a high index of stability of growth would be in an unattractive cell.
This suggests that this empirical calculation, which seems artificial, in fact is able to capture important processes and characterize the sustainability of the company's value growth.
easy
Downvoting a post can decrease pending rewards and make it less visible. Common reasons:
Submit
gufy
Downvoting a post can decrease pending rewards and make it less visible. Common reasons:
Submit
cool
Downvoting a post can decrease pending rewards and make it less visible. Common reasons:
Submit
cool
Downvoting a post can decrease pending rewards and make it less visible. Common reasons:
Submit
cool
Downvoting a post can decrease pending rewards and make it less visible. Common reasons:
Submit
cool
Downvoting a post can decrease pending rewards and make it less visible. Common reasons:
Submit
cool
Downvoting a post can decrease pending rewards and make it less visible. Common reasons:
Submit
cool
Downvoting a post can decrease pending rewards and make it less visible. Common reasons:
Submit
up voted and followed share the love
Downvoting a post can decrease pending rewards and make it less visible. Common reasons:
Submit
Thank you
Downvoting a post can decrease pending rewards and make it less visible. Common reasons:
Submit