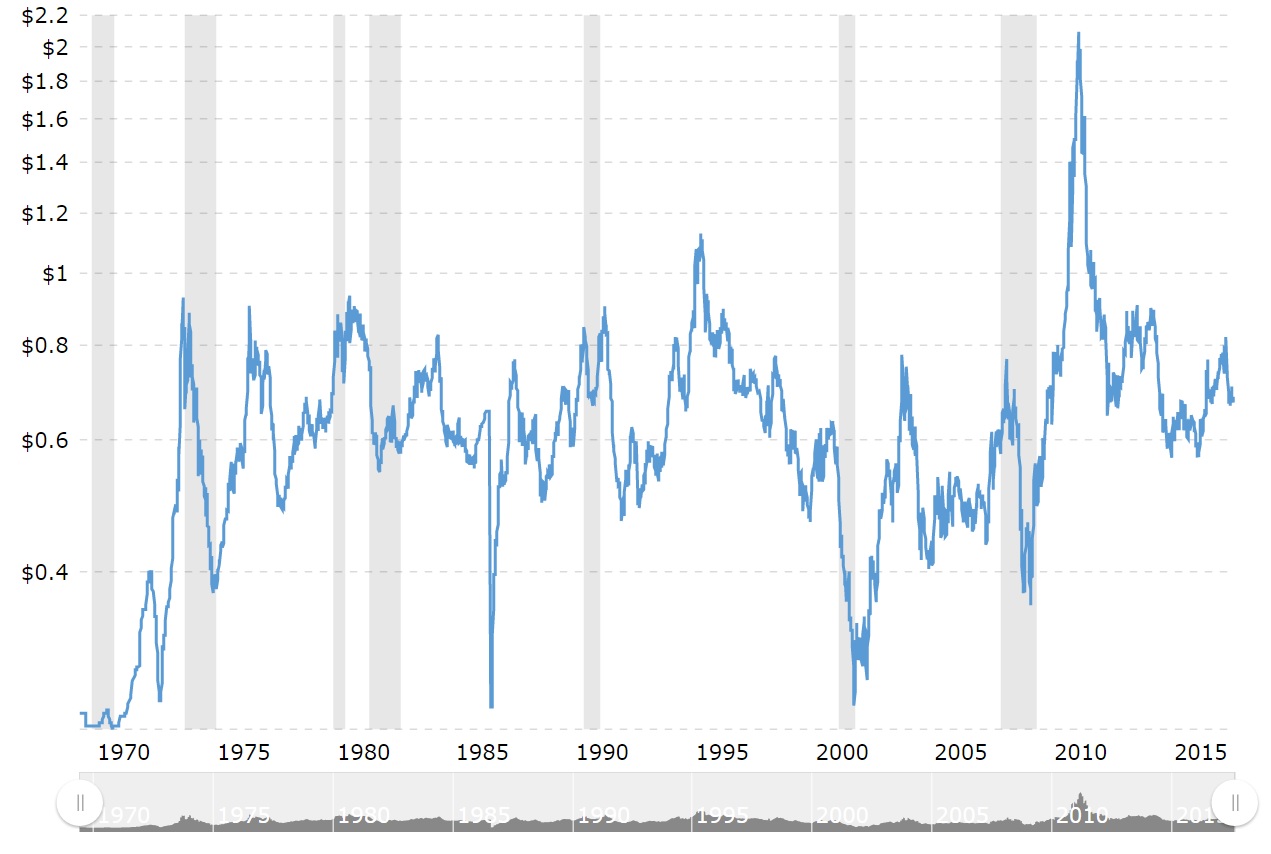
Looking a Cotton and the 50 years of growth in prices. Cotton over the years has been very volatile. If you look at the the chart below, the gray bars are recessions and the market price moves at large percentages. In 1969 it was 25 cents for cotton. The current price of cotton as of August 25, 2017 is $0.6845 per pound. This post is to give insight about this commodity.

Thank you for reading and have a wonderful day


Wow, looks like 2009 was a good time to invest.
Downvoting a post can decrease pending rewards and make it less visible. Common reasons:
Submit
yes, it does, and its very cheap to get into cotton. I love to show charts that many people easily look over. what is your favorite market?
Downvoting a post can decrease pending rewards and make it less visible. Common reasons:
Submit