Intro:
I will be using the Ichimoku Cloud as my trading tool along with some potential chart patterns to assist me in my predictions.
8/23/2018 11:58 pm MST
Imgur mirror: https://imgur.com/a/iWrQYFI

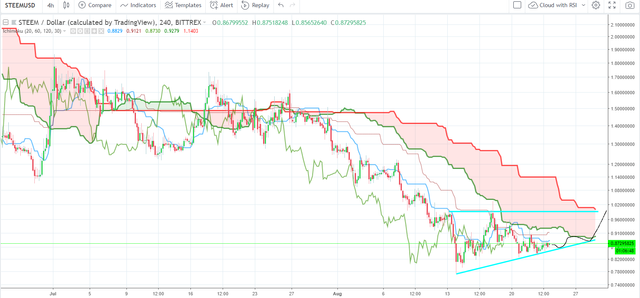
Steemit/USD seems to be seeing some resistance at the Tenkan-Sen (light blue, Ichimoku cloud) and saw previous testing on the Senkou Span A 20th and tested it on the 18th a few days prior with the long red candle up to Span A. Further, which I did not include in the picture, the volume is lacking on steemit. Potentially, showing little interest. I would like to see a few more tests of the Senkou Span A and a large volume jump with the test up to Span A. Although, steemit, looking at the cloud, has been in a large down trend as the cloud is red and quite large, confirming the trend. However, it might begin to close soon. As both leading span's are coming together right at the edge of the projection. Personally, I don't steemit breaking a dollar soon, based on the information I see here. I see it testing Span A a few more times over the next three days. Then possibly breaking out if volume supports it.
I think my added black line (which is where I think it could go) was over zealous.
Prediction:
Here I make a prediction for the next 24 hours. It has to be testable. Personally, I think it will be trading sideways for the next 24 hours while it, hopefully, builds momentum for a bigger move to break out of the Tenkan and Span A.
I think the price will be within 84 cents and 90 cents.
Current prediction results:
Here I keep a tally of how my predictions held up. Since I did not do a TA yesterday and today is the first official day, there are no results. But I suppose I should make a few rules. Since TA is more of an art than a science but while also trying to keep it rigorous I need rules.
If at the time of looking at the chart, at midnight MST, the price is outside of my bounds, my prediction will be counted as a failure.
If the price has spent more than 50% of the day outside of my bounds or prediction, then I've also failed. (might be difficult to figure this out with my current tools)
I can never have more than a 6 cent range.
I can make a "up" or "down" prediction but rule 1 still applies - I might remove this rule too, feels kind of like a cop out.
Quick definitions:
The Blue line in is Tenkan-Sen (Conversion Line). It’s the midpoint of the last 20 price bars.
The light red (non-thick) line is Kijun-sen (Base Line). It’s the midpoint of the last 60 price bars
The Green (Thick) line is Senkou Span A (Leading Span A).
The red (Thick) line is Senkou Span B (Leading Span B). Both leading spans are plotted into the future.
The green line is the Chickou Span (Lagging Span), and will always lag behind the price; it’s the most recent price, plotted 30 periods back.
Conclusion:
Feel free to leave feed back, comments, and suggestions on anything - from the rules, to the quality of my TA, to how I could improve, ect.
If you are wondering why I'm doing this or why I'm creating rules or testing my predictions. Follow this link.
If you liked this content feel free to reblog, follow, and comment.
Who is klabboy?
I’m different than some steemians. I have never been be paid to create content (baring likes from fellow steemians), I have never paid for upvotes, and all my content is 100% created by me. Nothing fake, no agenda, just my thoughts, and your comments.
Further, I’m a stutterer, crypto-enthusiast, economics student, data nerd, and outdoors lover. I post mostly on economics, data, personal fun/stories, and crypto. If you have an interest in those things and the occasional random topic, feel free to like, follow, and reblog my content. Hope to hear from you in the comments! Have a wonderful day!