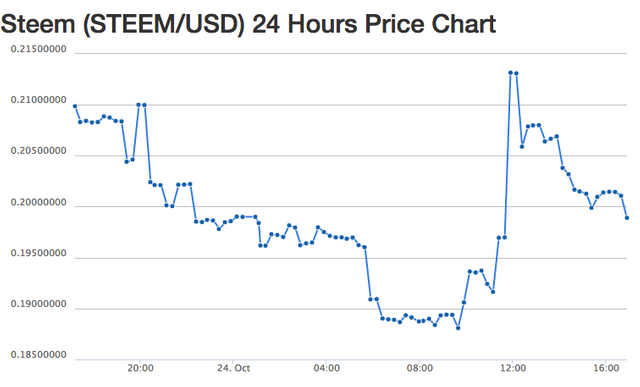
source: https://www.coingecko.com
Recent 13% upswing after 0.1881 low did not appear to reverse downtrend. The question is, if this spike reflects the pattern (previous spike was 11%), do we now see continued downtrend observed?

source: original analysis based on coingecko.com 60d chart
~0.18 to ~0.165 lows before significant (~30+%) jump is predicted. Seems we are getting close to such a jump. We will see if the pattern holds.
Has a new support low just formed?
If we take recent spike of 13% as a new peak - then a ~40% downtrend will set the new price at 0.128.
The only way to be sure is if the STEEM/USD price breaks through the 0.1650 floor anticipated in the analysis.
If the trend reverses upward, expect a high peak price of ~0.2445. We will have to revisit and see if support beyond that peak is achieved (and potentially reflect a shift in the 60 day trend).
It's clear to see in your higher-timeframe chart that the angle of descent is lessening over time. If investors are lucky, this is where we start to form the rounded bottom, before continued price appreciation.
Downvoting a post can decrease pending rewards and make it less visible. Common reasons:
Submit
yes it seems to appear the 'sellers' are pushing it down about 40% relative to a previous wave/ripple up..so it looks like it's flattening out but if it falls below the 0.1800 - 0.1650 it would still be a similar relative loss as before (ignoring the recent spike up - based on congecko's data it doesn't look like they are capturing the intraday spikes...looks more like the average for the 24 hour period that they use as the data point. I'm very curious to see if it goes below the 0.1800, or if we've seen the start of the appreciation.
Downvoting a post can decrease pending rewards and make it less visible. Common reasons:
Submit