Remember U Can Use my MULTIDIAGONALS on ANY Chart & ANY TIMEFRAME Most IMPORTANT U Can Calculate BUY Entries Well BEFORE they OCCUR Id Like to Refer Back to #STAR Starcom as a Prime Example this is a Tiny Tech Stock on the UK AIM Market
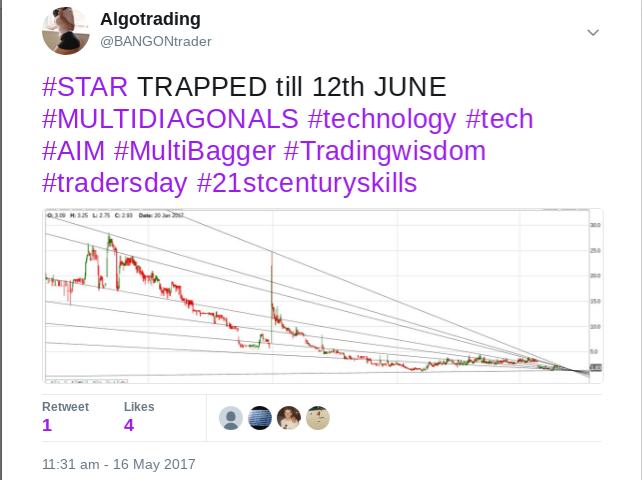
I have Followed this Stock for a While it is Very Popular on my TwitterFeed I was asked MAY 16th to produce a Chart (see Below)

The Chart Showed a CONFLUENCE(meeting point) Around 12th JUNE this is Where I Expected it to Bottom & Subsequently Take Off..However I produced a more Complex Chart..the 'Algorithms Eye-View' Which gave the Close Up Direction based on the PRIMARY #MULTIDIAGONALS (see below)
Ok so heres the 'Science Bit' Today Most Trading is Automatic..Algorithms are Programmed to Watch these Multidiagonals and BUY(& SELL) where they Meet..see the Chart Today..#STAR bounced 50% (see below)but so far STILL Lies Within the Bigger Triangle Awaiting CONFLUENCE in JULY..
This may all sound a bit Far Fetched to those who practice Old Skool technicalanalysis.. but Ive been doing this for over 6 Years with FANTASTIC Results...Remember this is UNIQUE..but with a little practice U TOO could be Finding Stocks that #multibag with PRECISION Entries..NO Holding Stocks for Years..Happy #Trading