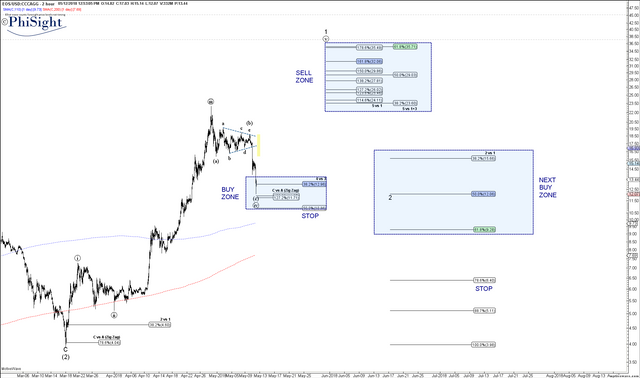
Here is my latest TA chart on EOS/USD price:
.png)
and a zoomed in 1 hr chart:
.png)
I had presented this earlier chart on EOS/USD in this writeup on May 12:
https://steemit.com/photography/@phisight/bitcoin-chart-pattern-rhymes-with-ongoing-fractal-in-eos

Seems that a final squiggle lower is needed to complete the ending diagonal 5th wave in the C wave of the 4th wave as long as price stays below 14.5....the fractal description can get quite involved but this is the amazing achievement of Elliot, to develop a language to describe it. The final decline should ideally terminate between 10.86 and 11.71.
Hope this analysis was/is/will be helpful!
Note: you can right-click and open charts in new tab to see them at full size -- they are quite large and clear.

Another excellent call. Your uncanny ability to call these short term moves while maintaining a long term view is impressive.
Downvoting a post can decrease pending rewards and make it less visible. Common reasons:
Submit