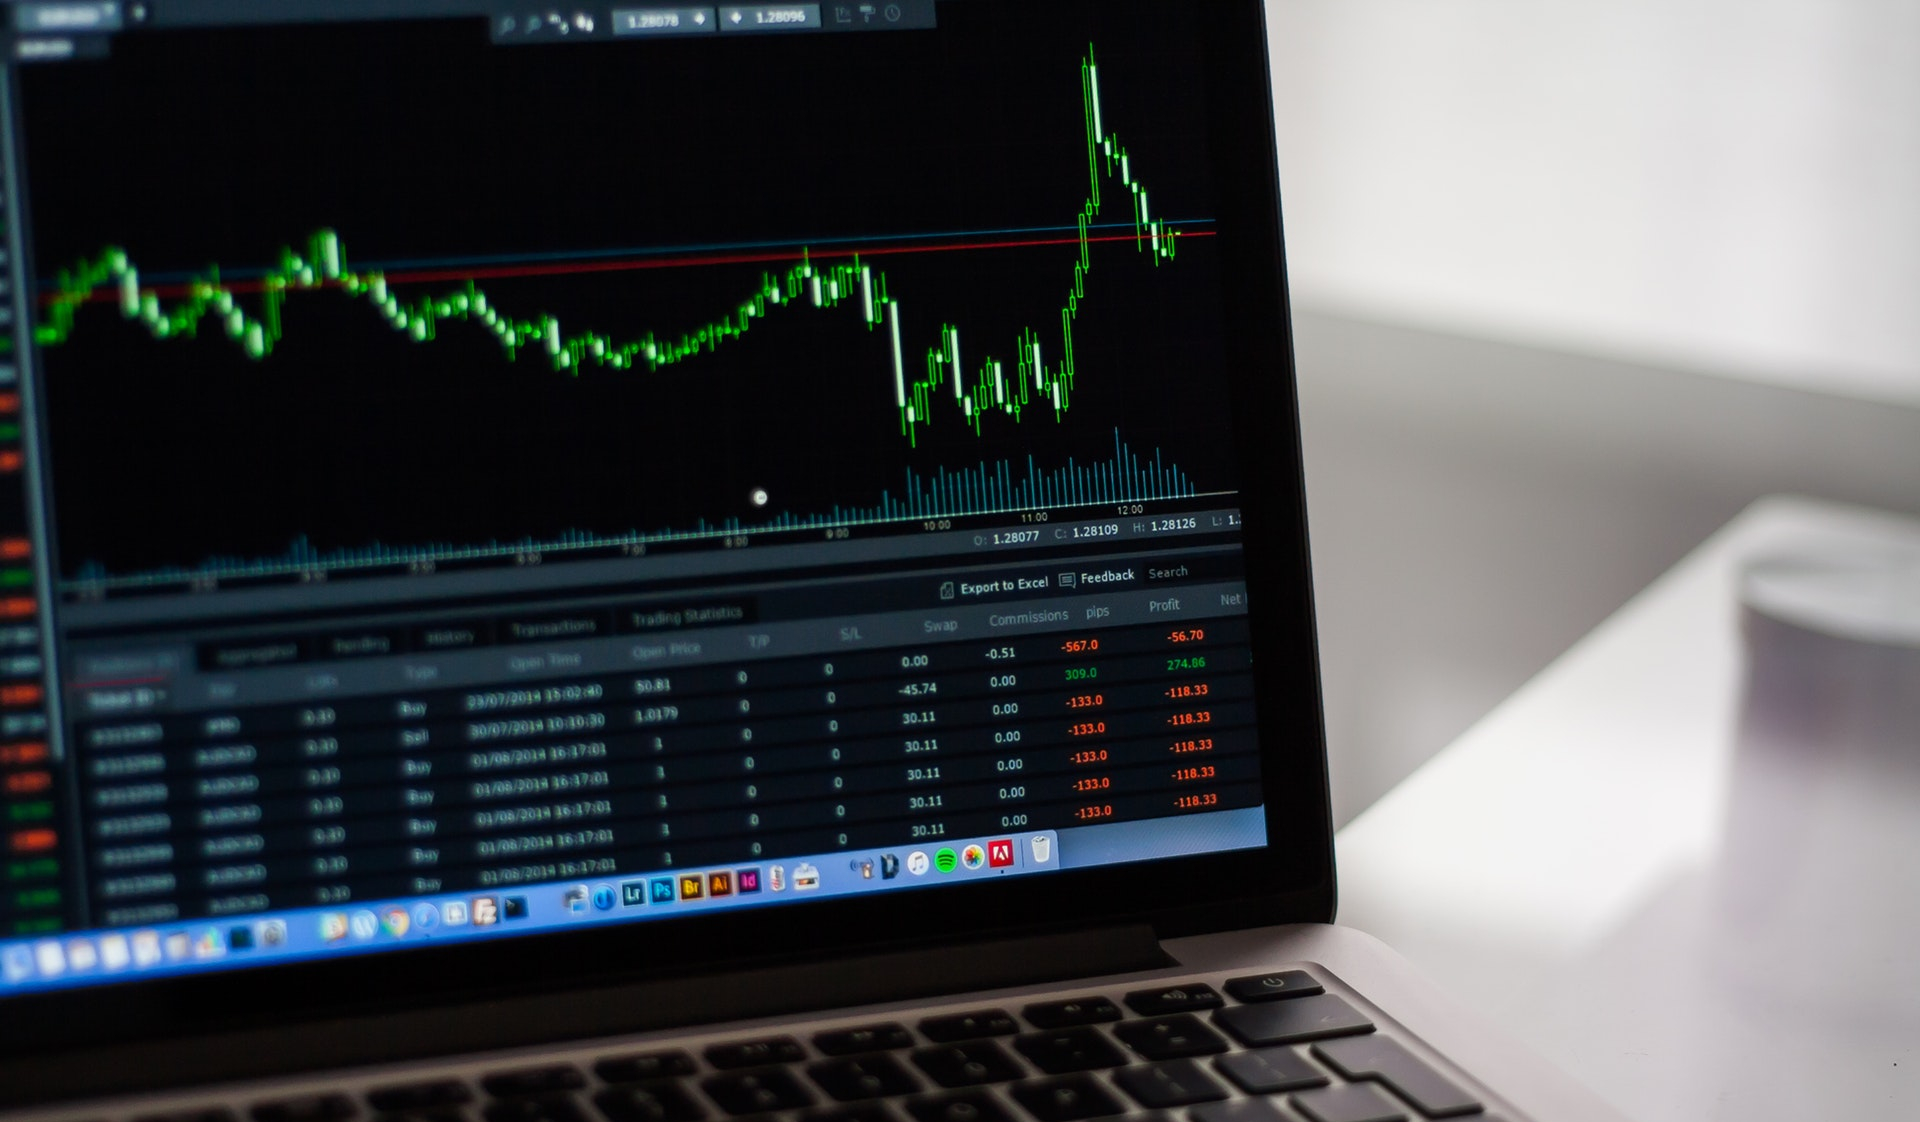
Let's face it technical analysis is bullshit. I can't believe most people are tied up with that nonsense, you know drawing silly things on the chart and they think they are doing forecasting. It's more like forecasting from chicken bones or tarot cards. Complete nonsense.
That being said, moving averages are real and good tools, however you have been probably using them wrongly. If you were doing moving average crossovers or any other things like that, then you are using them wrongly. That is nonsense as well.
Let me teach you how to use moving averages properly, scientifically, quantitatively.
Structure of the Market
The market is a heteroskedastic conditional joint-probability distribution that is a function of time, or simply put a time-series. (A non-seasonal, non-stationary time-series for that matter to be precise.)
That means that it constantly changes with time, the mean and variance can change over time and the variance might be infinite. In other words the mean and the variance are also variables, not constants, not like the probability distribution of a dice roll where the mean is 3.5 and the variance is 2.91(6), and it doesn’t change. Thus our model has to reflect this change, it can't be static, and even more, it can't be arbitrary.
The Purpose of Moving Averages
So the purpose of the moving averages is to model the price and use it for forecasting. That's it. No crossovers and nonsense like that. It is a modeling & forecasting tool.

Simple Moving Average
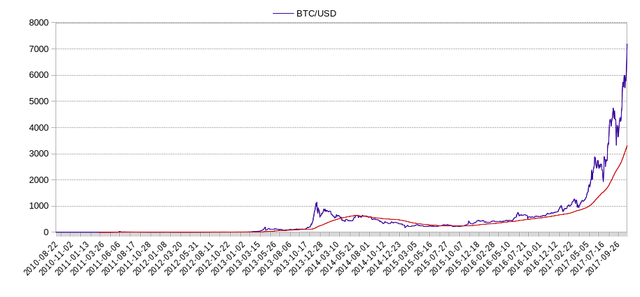
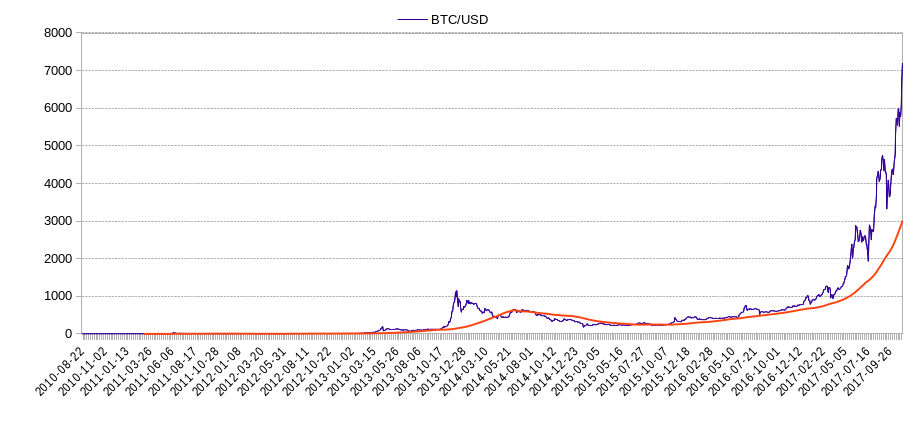
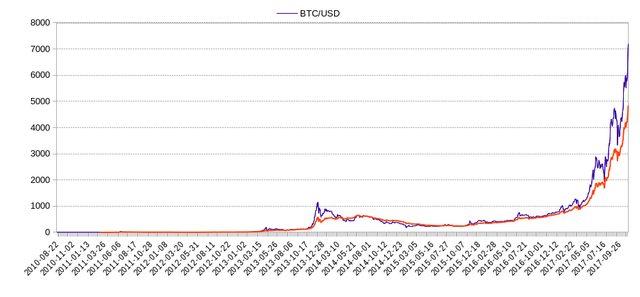
Now the simple moving average is the most simple tool that people can use. It's basically the mean of the price. Or at least the local mean, since it's usually segmented into periods. Now this is a problem of course, because it makes the model arbitrary. I mean which is the correct SMA, Period 50? Period 100? Period 200?
Well the truth is that none of them. The price is certainly efficient, so if a simple model like that could describe it, then people would exploit that information, and would not work anymore. So if everyone would put their trades at Period 50, then the price would reflect that and soon all profitability would be lost. It's simply just not possible to model it in that simple way, besides you have millions of actors in a market, so randomness will be added everywhere, thus a static model will not work.
Even if we would calculate which one is the best period, which can easily be done with a python script, in fact I already did this for the BTC/USD market, there are still no guarantees that this period will hold for long.
So with a SMA you have a model that is arbitrary and the best period can change anytime, in other words the parameters have a big covariance, and you don't want that.
You want a model where the parameters remain optimal throughout the entire series, or at least the majority of it, otherwise your model is rubbish, and it doesn't give you any kind of edge. You are back to tarot reading.

Other Simple Averages
So naturally if the SMA sucks then all of it’s variants will suck too, that is the:
And things like that. They are basically the same thing just with a slight spice. Or making it even worse like adding 1 more arbitrary parameter. The WMA is certainly like that, adding an arithmetically decaying weight. Well who said that that will improve things? You have just added 1 more uncertainty, and are not closer to the optimal model by a bit.

Exponential Moving Average
Now the EMA is different, a little bit. I’m not saying it’s optimal, but it’s the best kind of moving average. So if you are a “technical analyst”, you should probably use EMA if you really want to work with moving averages, which I don’t think you should do, but at least that is somewhat better.
However not entirely, it’s nowhere near the best model, but amongst the moving averages, it is the best one in my opinion. It’s included in most market analysis software, trading platforms, so at least it’s a better tool that can be worked with, not complete rubbish like the rest of them.
But of course, you have been probably using it wrongly too. If you are fooling around with crossovers, fibonacci numbers or any other bullshit like that, then you are doing it wrongly.
In the next article I will teach you how to use EMA properly, scientifically, quantitatively.
Sources:
https://www.pexels.com

Nice post. Moving average is indicator that is very useful for trading, but decision must be based on price action.
Downvoting a post can decrease pending rewards and make it less visible. Common reasons:
Submit
What do your mean by "price action" ?
Downvoting a post can decrease pending rewards and make it less visible. Common reasons:
Submit
Price movement on the chart, tests of resistance and consolidation are some examples of price action.
Downvoting a post can decrease pending rewards and make it less visible. Common reasons:
Submit
What I'm getting from most of what you're saying here, is that technical analysis is by and large an instance of humans seeing patterns where there are none, that for example when the price movement on a chart paints a flag or a pennant, that there is no possible way to to tell in advance it would paint that picture, but that such patterns are merely assigned to it in hindsight. Is this on par with your view, or am I misrepresenting it?
Downvoting a post can decrease pending rewards and make it less visible. Common reasons:
Submit
Yes what I am saying is that what patterns people think they see via TA is false.
There certainly are patterns in the market, otherwise it would be random. I think the efficient market hypothesis is not entirely correct. I think the market tends towards efficiency but it's not efficient at every single datapoint, so that can be exploited.
But the patterns are very subtle, probably impossible to see with naked eye. It would be something like a relationship based on a complicated formula, not like a candlestick or any other nonsense like that.
So visual TA is nonsense as it is, there is no other way to put it. But that doesn't mean that with quantitative analysis you can't make some progress in decyphering the market.
Downvoting a post can decrease pending rewards and make it less visible. Common reasons:
Submit