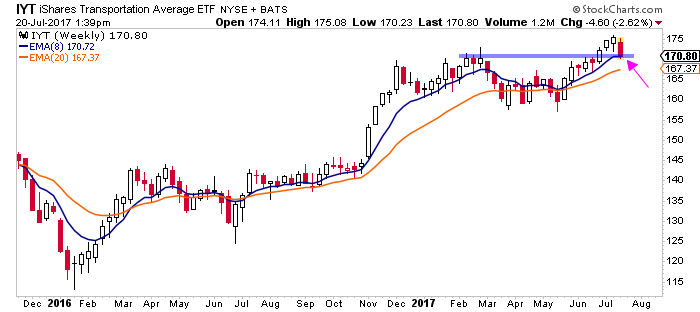
The Dow Jones Transportation Average represented by the $IYT ETF has been a strong performer throughout May and June. It broke out to new all time highs on July 3rd, resolving a multi-month range sideways.
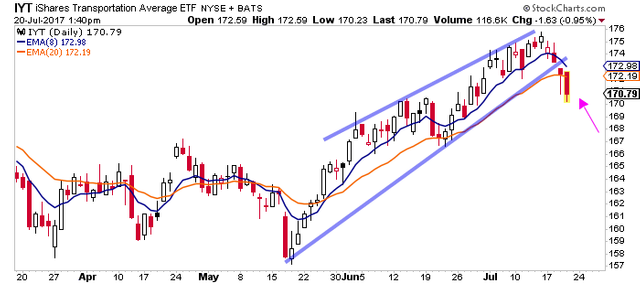
However, over the past week of trading, we’re seeing some near-term selling pressure come through, and a break of this accelerated bullish trend line.
Here’s the IYT on the daily:

The daily looks rough, but when we zoom out to the weekly, we can see we are simply re-testing the breakout area in a long term bullish uptrend.

For you dip buyers out there, it’s probably worth paying attention to this pullback and general area for an opportunity to get on board a recently emerged breakout (if it holds).
For you bears, you’re looking for this to collapse back down through those June highs signaling a “false breakout” and maybe even the start to something a bit broader.
For some added beta, look at some of the underlying stocks within this ETF.
They’re industrials, specifically: Airlines, Railroads, Transportation & Shipping.
My favorite trade ideas on the long sidse would be $DAL, $FDX, $LSTR.
Good luck out there.
This article was originally published on The Trade Risk.